
|
Fig. 5
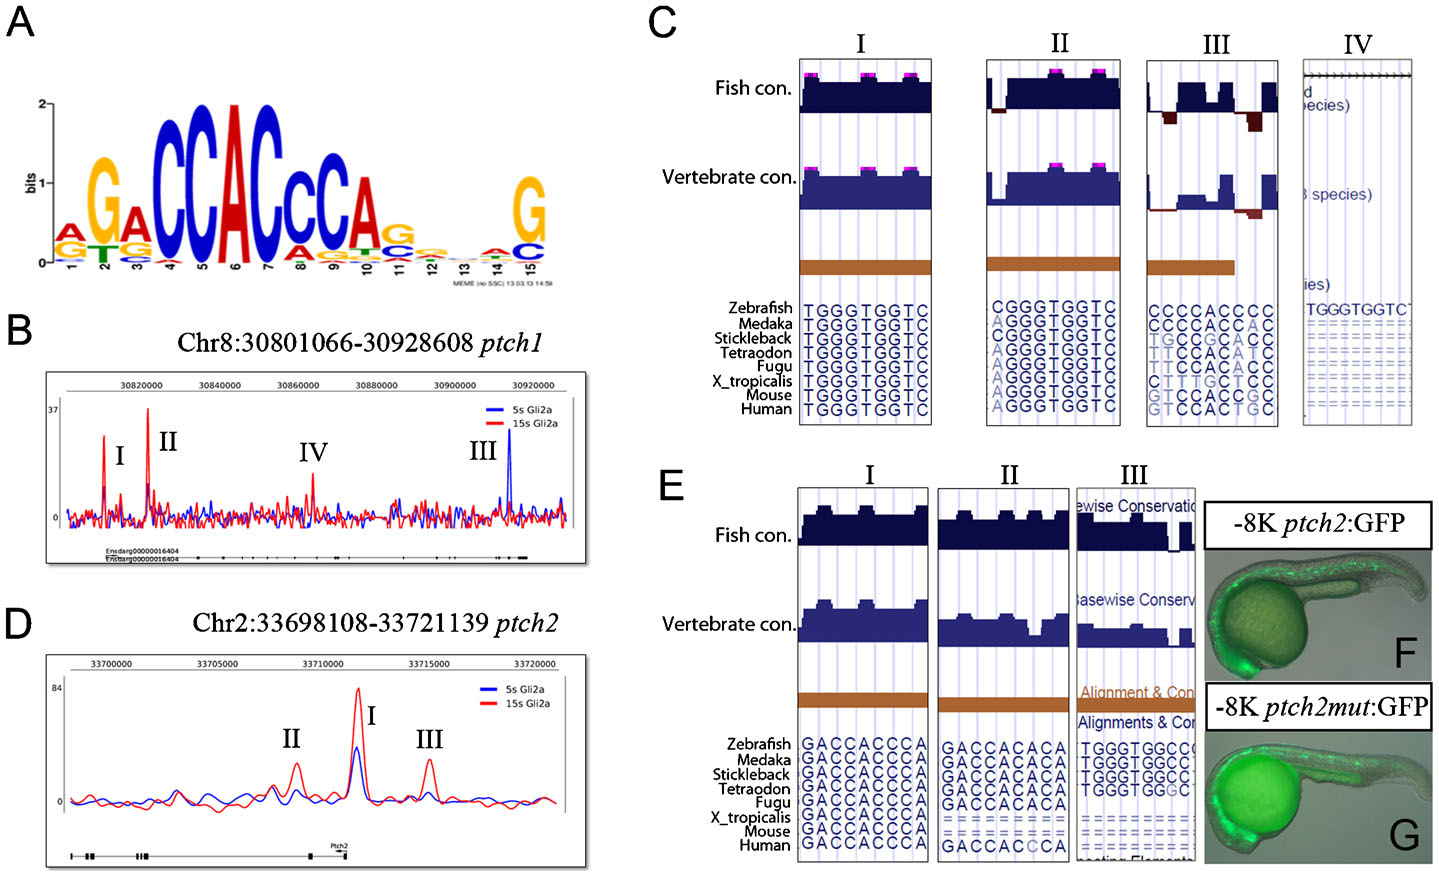
Gli bound region on ptch1 and ptch2 genomic locus.
(A) The consensus Gli binding site (GBS). (B) Profile of Gli2a ChIP-seq sequence enrichment at the ptch1 genomic locus. (C) Predicted GBS located within each peak (I–IV) and their conservation between different species. (D) Profile of Gli2a ChIP-seq sequence enrichment at the ptch2 genomic locus. (E) Predicted GBS located within each peak (I–III) and their conservation between different species. (F) Transient expression of GFP driven by a wild-type 8kb ptch2 promoter fragment that includes the Peak I GBS. (G) Transient expression of the same reporter in which the GBS is mutated.