
|
Fig. 1
Spiral Fiber Neurons Respond to Aversive Stimuli
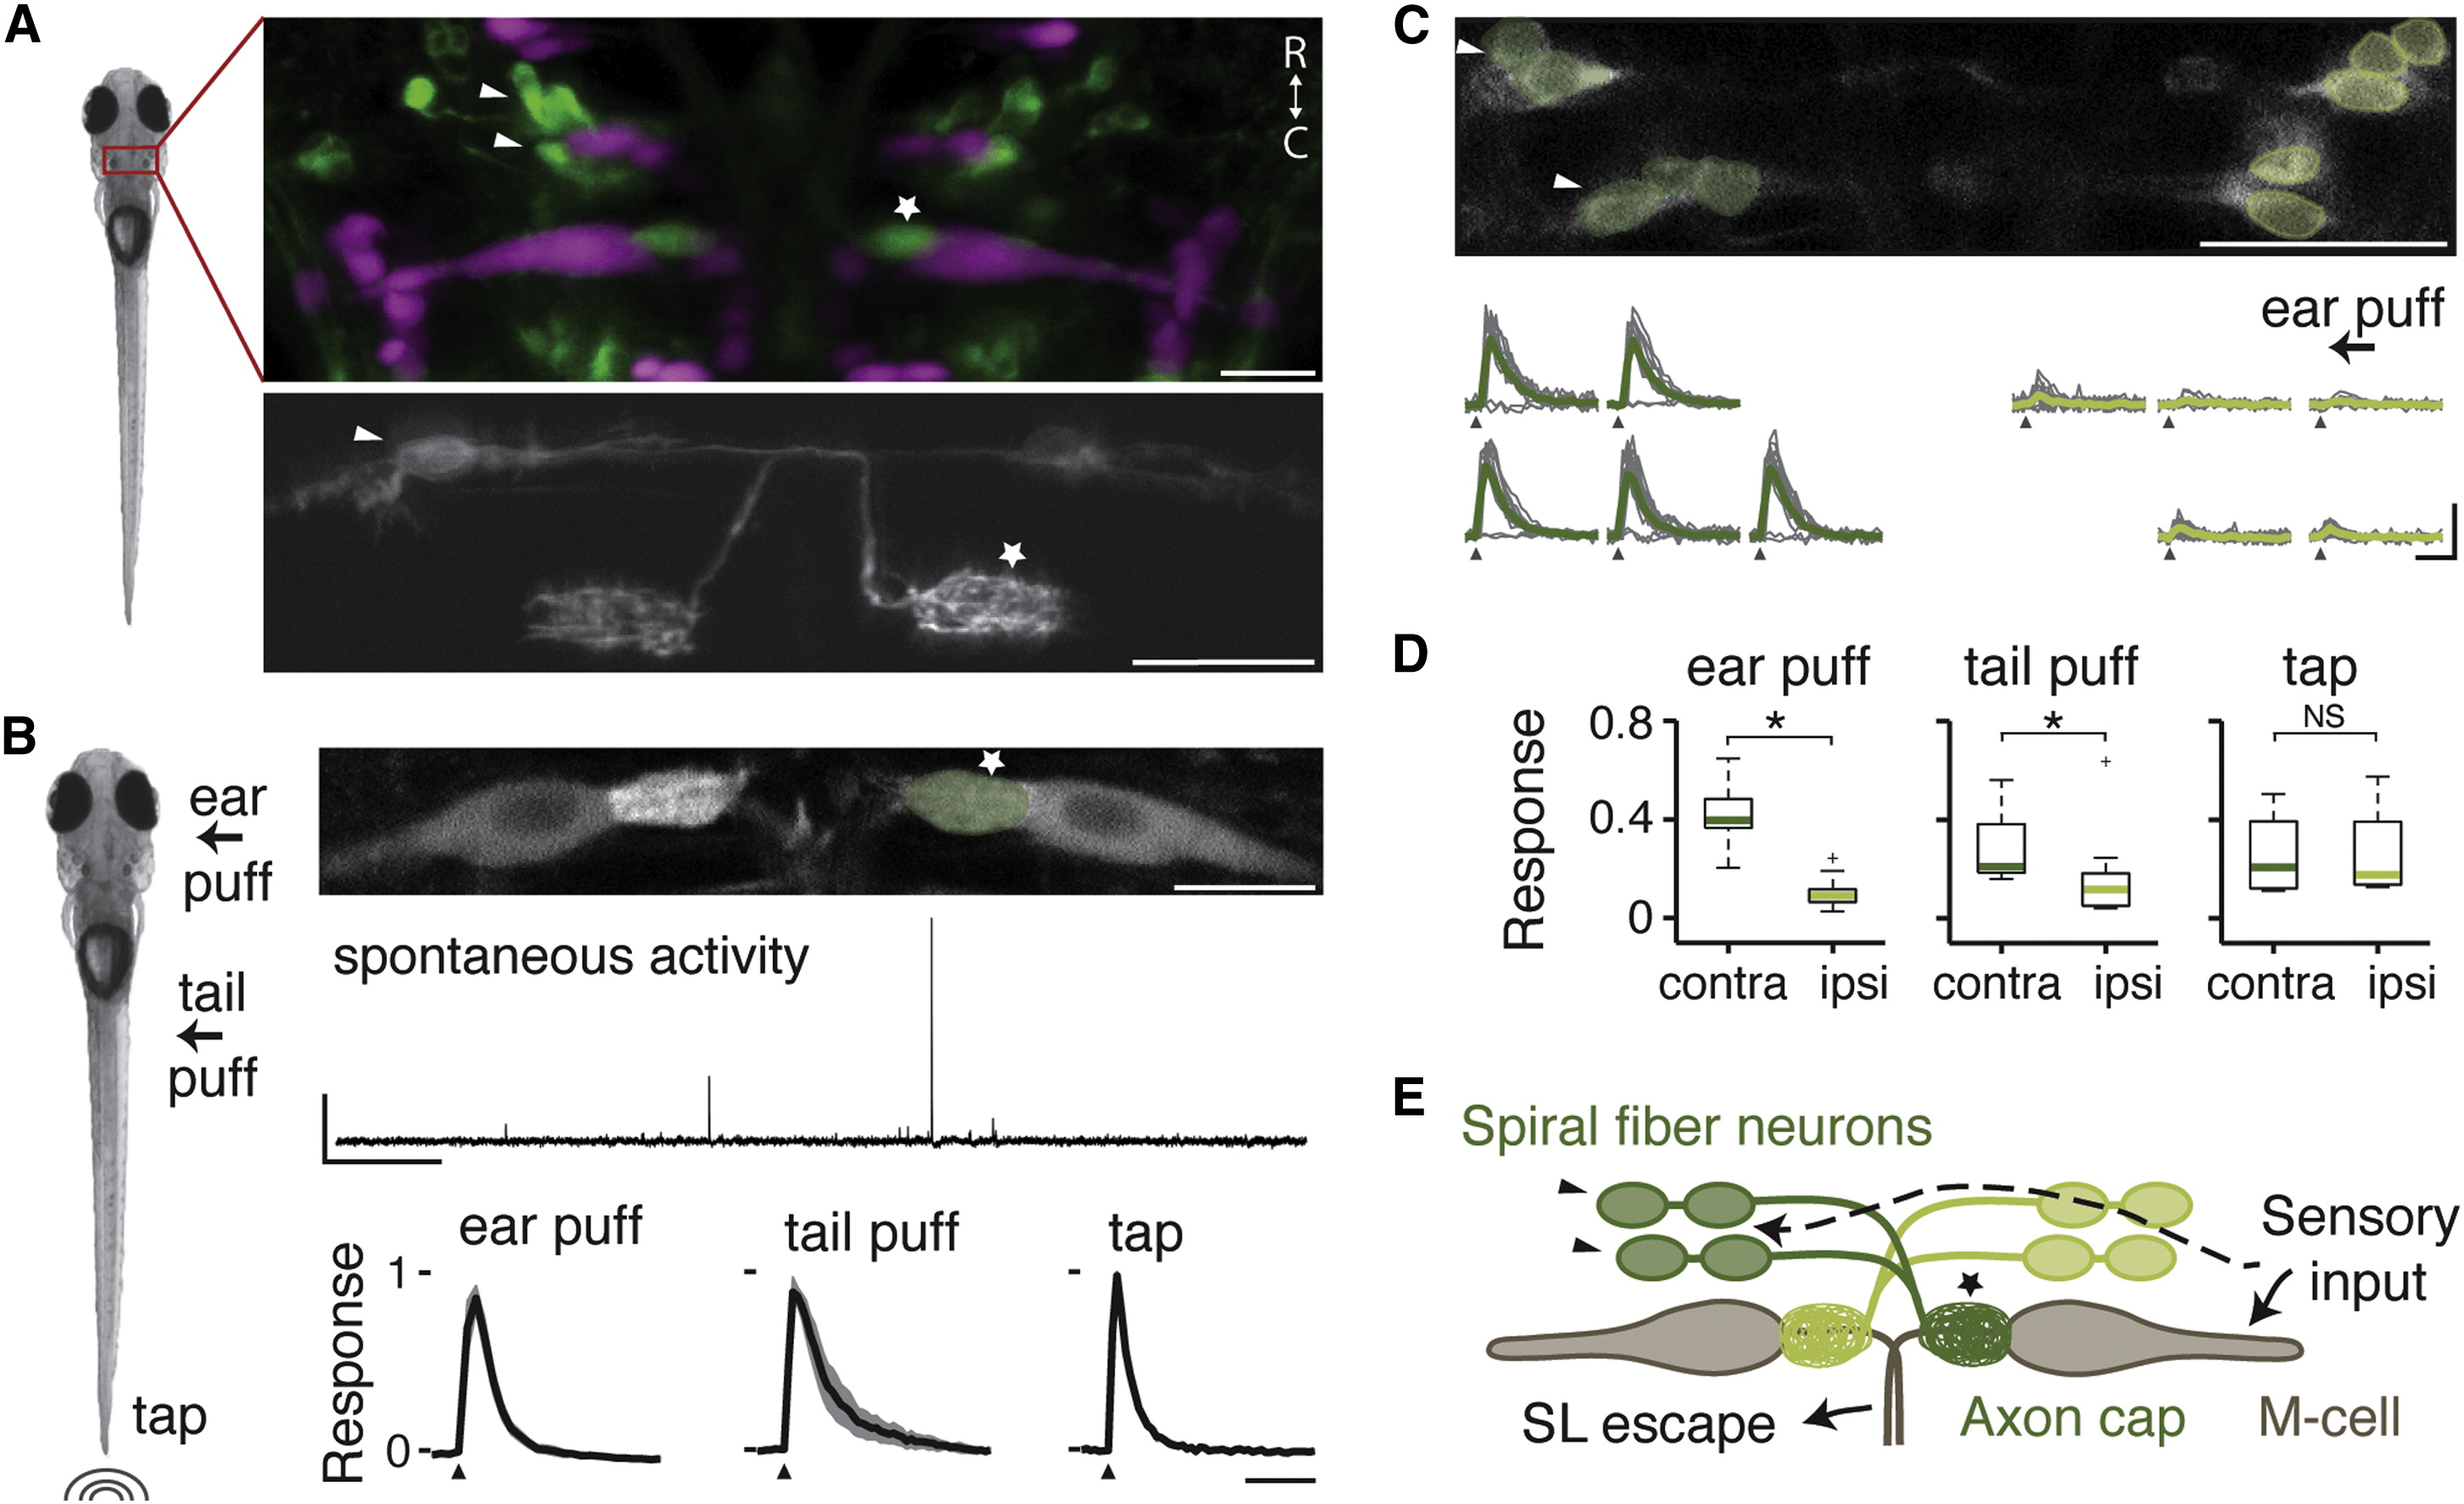
(A) Left: 5-day-old zebrafish larvae. Top: Tg(-6.7FRhcrtR:gal4VP16); Tg(UAS:GCaMP5) labels spiral fiber neurons (arrowhead) among other neurons. The M-cell and other reticulospinal neurons are labeled with tetramethylrhodamine dextran by reticulospinal backfill. Spiral fiber neuron cell bodies are located in rhombomere 3 in two rostro-caudal (R← →C) clusters, approximately 25-40 µm rostral, 5-15 µm lateral, and 0-20 µm ventral of the axon cap (star). They all have axons descending contralaterally into the axon cap of the M-cell. Bottom: transient expression of membrane-targeted GFP (UAS:GAP43-GFP) in Tg(-6.7FRhcrtR:gal4VP16) labels two spiral fiber neurons on the left and one spiral fiber neuron on the right that project to the contralateral M-cell axon cap.
(B) Left: three different stimuli were delivered to paralyzed zebrafish larvae—water puffs directed at the right ear, water puffs directed at the right side of the tail, and non-directional taps delivered onto the dish holding the fish. Top: projection of two-photon image stack showing M-cells and spiral fiber neuron axon terminals labeled with the calcium indicator Tg(UAS:GCaMP-HS) driven by Et(fos:Gal4-VP16)s1181t and Tg(-6.7FRhcrtR:gal4VP16), respectively. middle: Typical spontaneous activity in the spiral fiber neuron axon terminals. Scale bars represent 5 min horizontally and1 Δf/f vertically. Bottom: mean response amplitude in the right spiral fiber neuron axon terminals for different stimuli: ear puffs (n = 7, left), tail puffs (n = 5, center), and taps (n = 6, right). For each fish, the change in fluorescence (Δf/f) from trials in which the axon cap was active was normalized to the maximum Δf/f across trials and then averaged. The black line is the mean across fish with the SEM shaded. Stimulus delivery is indicated by an arrowhead. The horizontal scale bar represents 2 s.
(C) Top: single recording plane showing spiral fiber neuron somata in Tg(-6.7FRhcrtR:gal4VP16); Tg(UAS:GCaMP-HS). Bottom: mean Δf/f across trials in green and individual trials in gray for spiral fiber neuron somata from the top panel located on the left (dark green) and on the right (light green) responding to a water puff delivered to the right ear (arrow). Contralateral spiral fiber neurons respond to the stimulus, but ipsilateral spiral fiber neurons do not. Traces in which spiral fiber neurons on the left do not respond correspond to the same trials. Note that while caudal neurons seem to respond before rostral neurons, this is an artifact of the delay introduced by two-photon line scanning. Scale bars represent 2 s horizontally and 2 Δf/f vertically.
(D) Boxplot showing the normalized response of spiral fiber neurons across fish. Response was defined as the area under the Δf/f curve over a 1.5 s response window. This was normalized for each cell to the maximum response observed in a given experiment, and then cells located on the contralateral and ipsilateral side with respect to the stimulus were averaged. Green lines are the medians across fish, box edges are the 25th and 75th percentiles, the whiskers extend to the most extreme data points not considered outliers, and crosses are outliers. The following stimuli were delivered: ear puffs (left; n = 10 fish, p = 2.5 × 10⁻⁴), tail puffs (center; n = 10, p = 0.02), and taps (right; n = 4, p = 0.89). p < 0.05; NS, not significant by Wilcoxon rank-sum test.
(E) Model showing the M-cells receiving ipsilateral sensory input, which includes auditory/vestibular afferents onto the lateral dendrite. Our results suggest that spiral fiber neuron somata receive similar sensory information from the contralateral side.
Pictures are oriented rostral up. Scale bars represent 20 µm. Arrows point to spiral fiber neuron somata, and a star indicates spiral fiber neuron terminals at the M-cell axon cap. Contra, contralateral; ipsi, ipsilateral; SL, short latency. See also Figure S1 and Movie S1.