
Image
|
Figure Caption
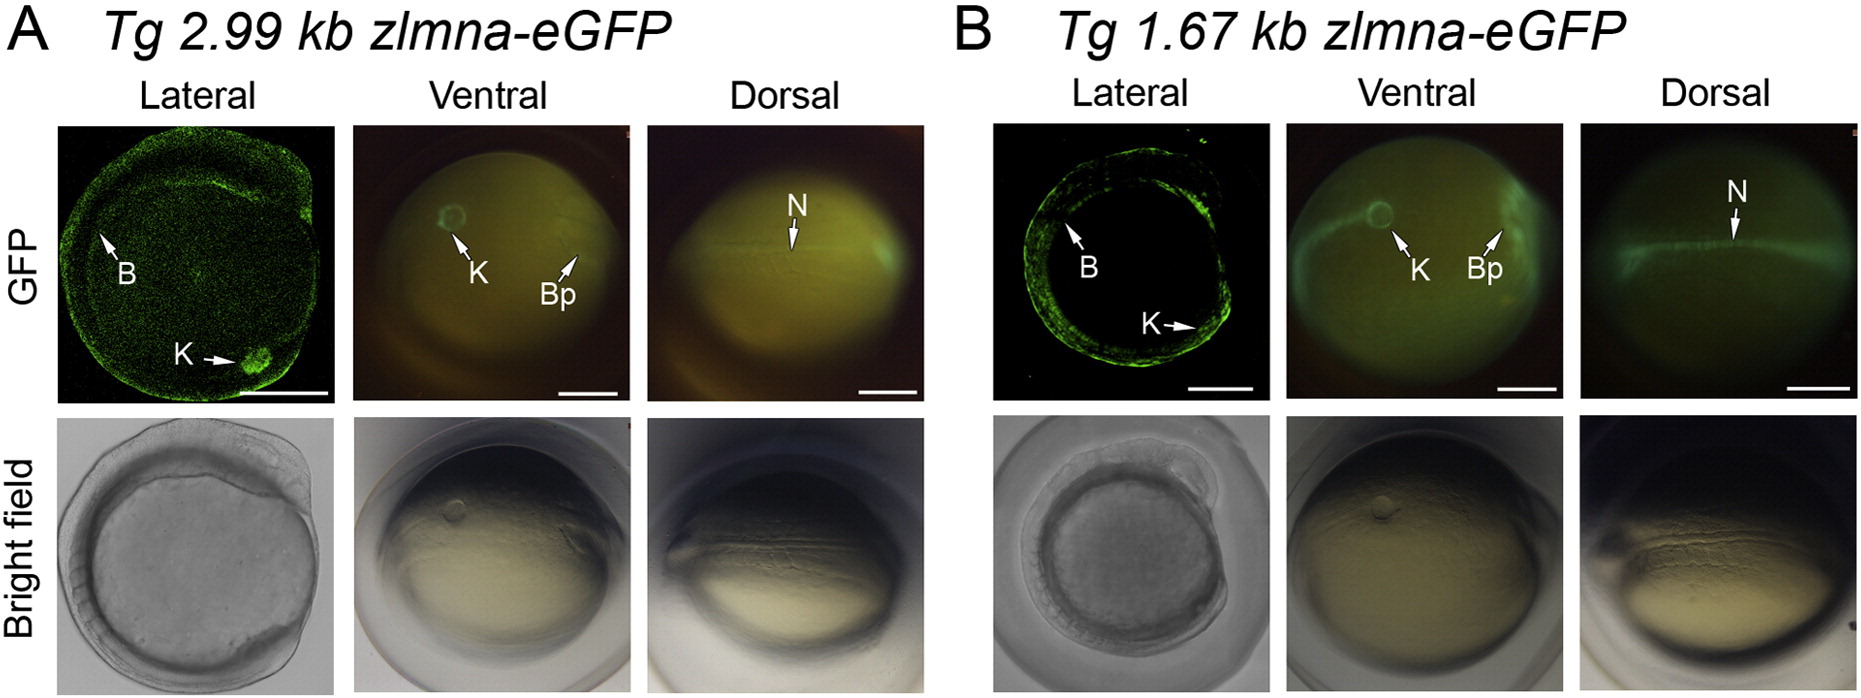
Fig. 2
Activity of the zlamin A promoter in transgenic zebrafish embryos at 14 hpf of development. (A) Tissue-specific expression of GFP driven by the 2.99 kb promoter region in Kupffer′s vesicle (K), boundary between the embryonic shield and blastodisc (B), and brain primordium (Bp). (B) Tissue-specific GFP expression driven by the 1.67 kb promoter segment. Similar patterns were obtained in two independent transgenic lines for each promoter fragment. CLSM images are shown for the lateral view, and regular fluorescence images for the dorsal and ventral views. Bar, 0.25 mm.
Acknowledgments
This image is the copyrighted work of the attributed author or publisher, and
ZFIN has permission only to display this image to its users.
Additional permissions should be obtained from the applicable author or publisher of the image.
Reprinted from Gene, 567(1), Verma, A.D., Parnaik, V.K., Identification of tissue-specific regulatory region in the zebrafish lamin A promoter, 73-80, Copyright (2015) with permission from Elsevier. Full text @ Gene