
|
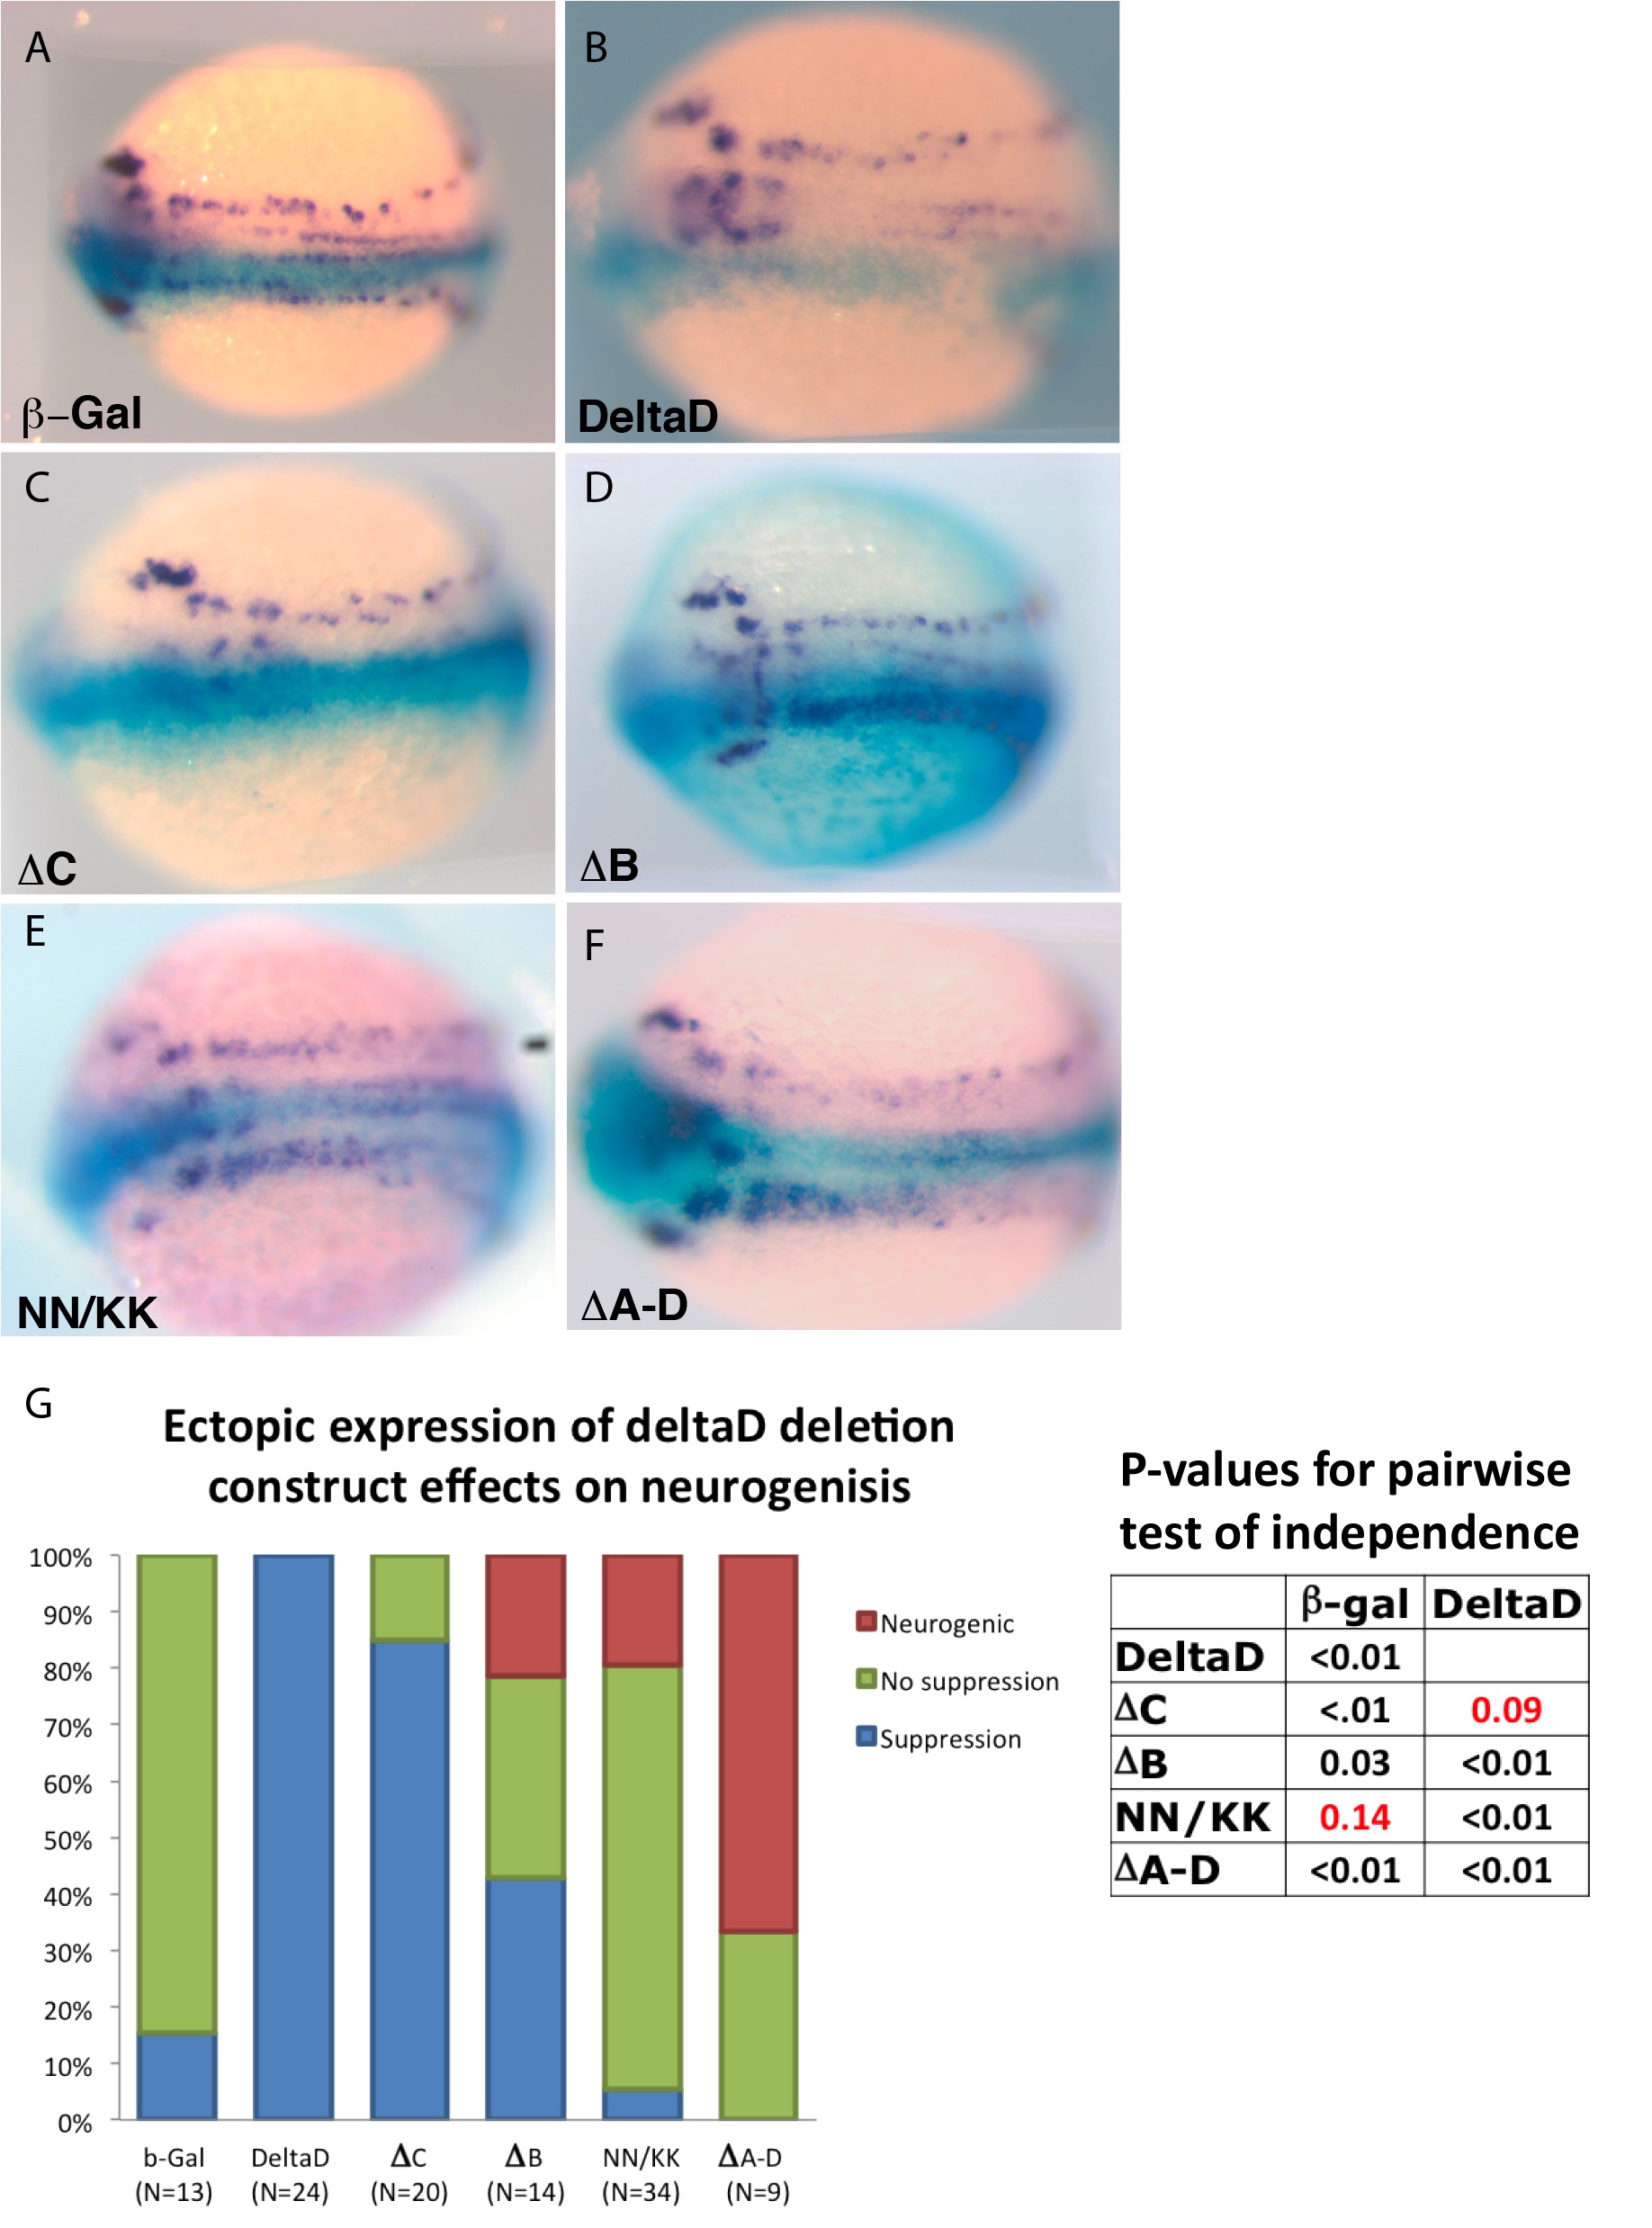
Fig. 5
Ectopic expression of deltaD deletion and point mutant recapitulates neurogenic phenotype of DeltaD (ΔA-D).
(A) The prospective distribution of neurons revealed by the distribution of huC as revealed by in situ hybridization probe (purple) in control embryos injected with only β-galactosidase mRNA. (B-F) huC in embryos co-injected with β-galactosidase and deltaD (B), deltaD-C (C), deltaD B (D), deltaD NN/KK (E) or DeltaD ΔA-D (F) mRNA. Distribution of ectopic mRNA injected in one cell at the two-cell stage revealed by X-Gal distribution (blue). Dorsal view, rostral to the left. Embryos are at approximately the 3 somite stage. (G) Quantification of the effect of ectopic expression of mRNA encoding various forms of DeltaD on the distribution of early neurons. Red indicates fraction with a neurogenic phenotype (increased density of neurons), Green—fraction with no obvious effect on neuron density, Blue- fraction with suppression of neurogenesis (reduced neuron density). P-values for pairwise comparison based on Fisher’s Exact test of independence. P >. 05 does not meet the criteria for the Null hypothesis that pairs contain an equivalent distribution of phenotype classes.