
|
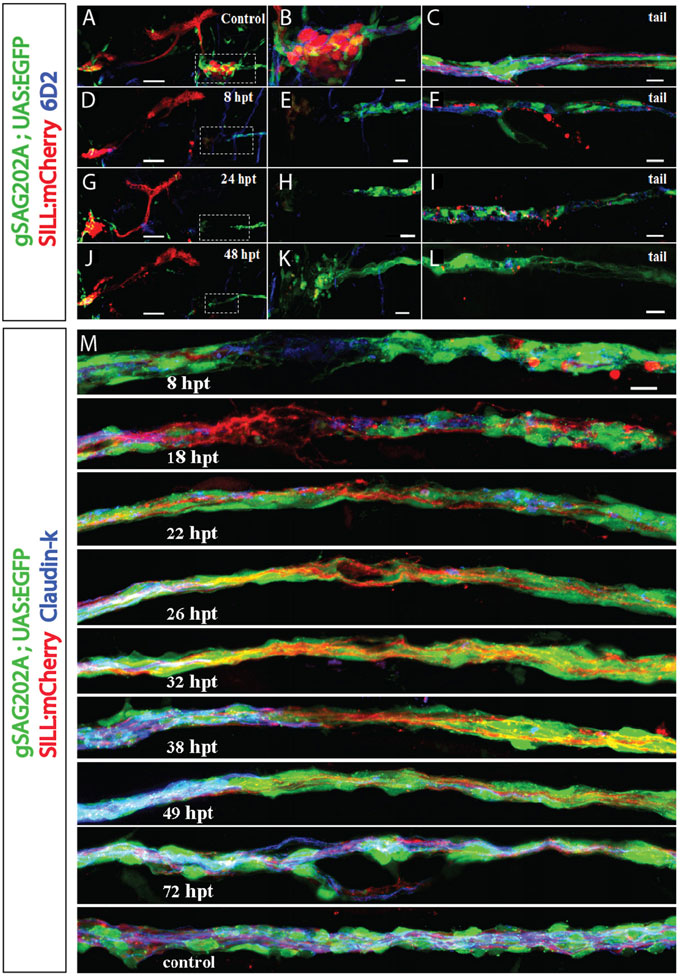
Fig. 5
Gradual loss of expression of myelin glycoprotein and Claudin-k junctional protein upon axon severing or ganglion ablation. (A-L) Maximal projection of Tg[gSAGFF202A;UAS:EGFP;SILL:mCherry] larvae immunolabeled with myelin 6D2 antibody (blue). (A,D,G,J) The cephalic region showing the anterior and posterior ganglion before ganglionostomy (A) and at 8-48hpt in fish with ganglion ablation (D,G,J). (B,E,H,K) Higher magnification of the boxed regions in A,D,G,J, respectively. (C,F,I,L) Images of the animals’ tail, corresponding to A,D,G,J. (D,G,J) At 8hpt, 24hpt, 48hpt, immunostaining images reveals gradual loss of myelin protein. (F,I,L) Immunostaining of fish tails delineates the loss of myelin and clearance of axon debris in a gradual manner. (M) Time-course analysis of axonal regeneration and Claudin-k junctional protein expression (blue) in the Schwann cells around the site of damage. Claudin-k is present along the perineurium in control fish (lowest panel). A marked reduction of Claudin-k in the perineurium distal to the cutting site can be seen at 8hpt. Distal Claudin-k protein levels remain lower than on the proximal part of the perineurium even after axonal regeneration at 26hpt, and only level-up around 72hpt. Scale bars: 50µm (A,D,G,J), 10µm (all others).