
|
Fig. S3
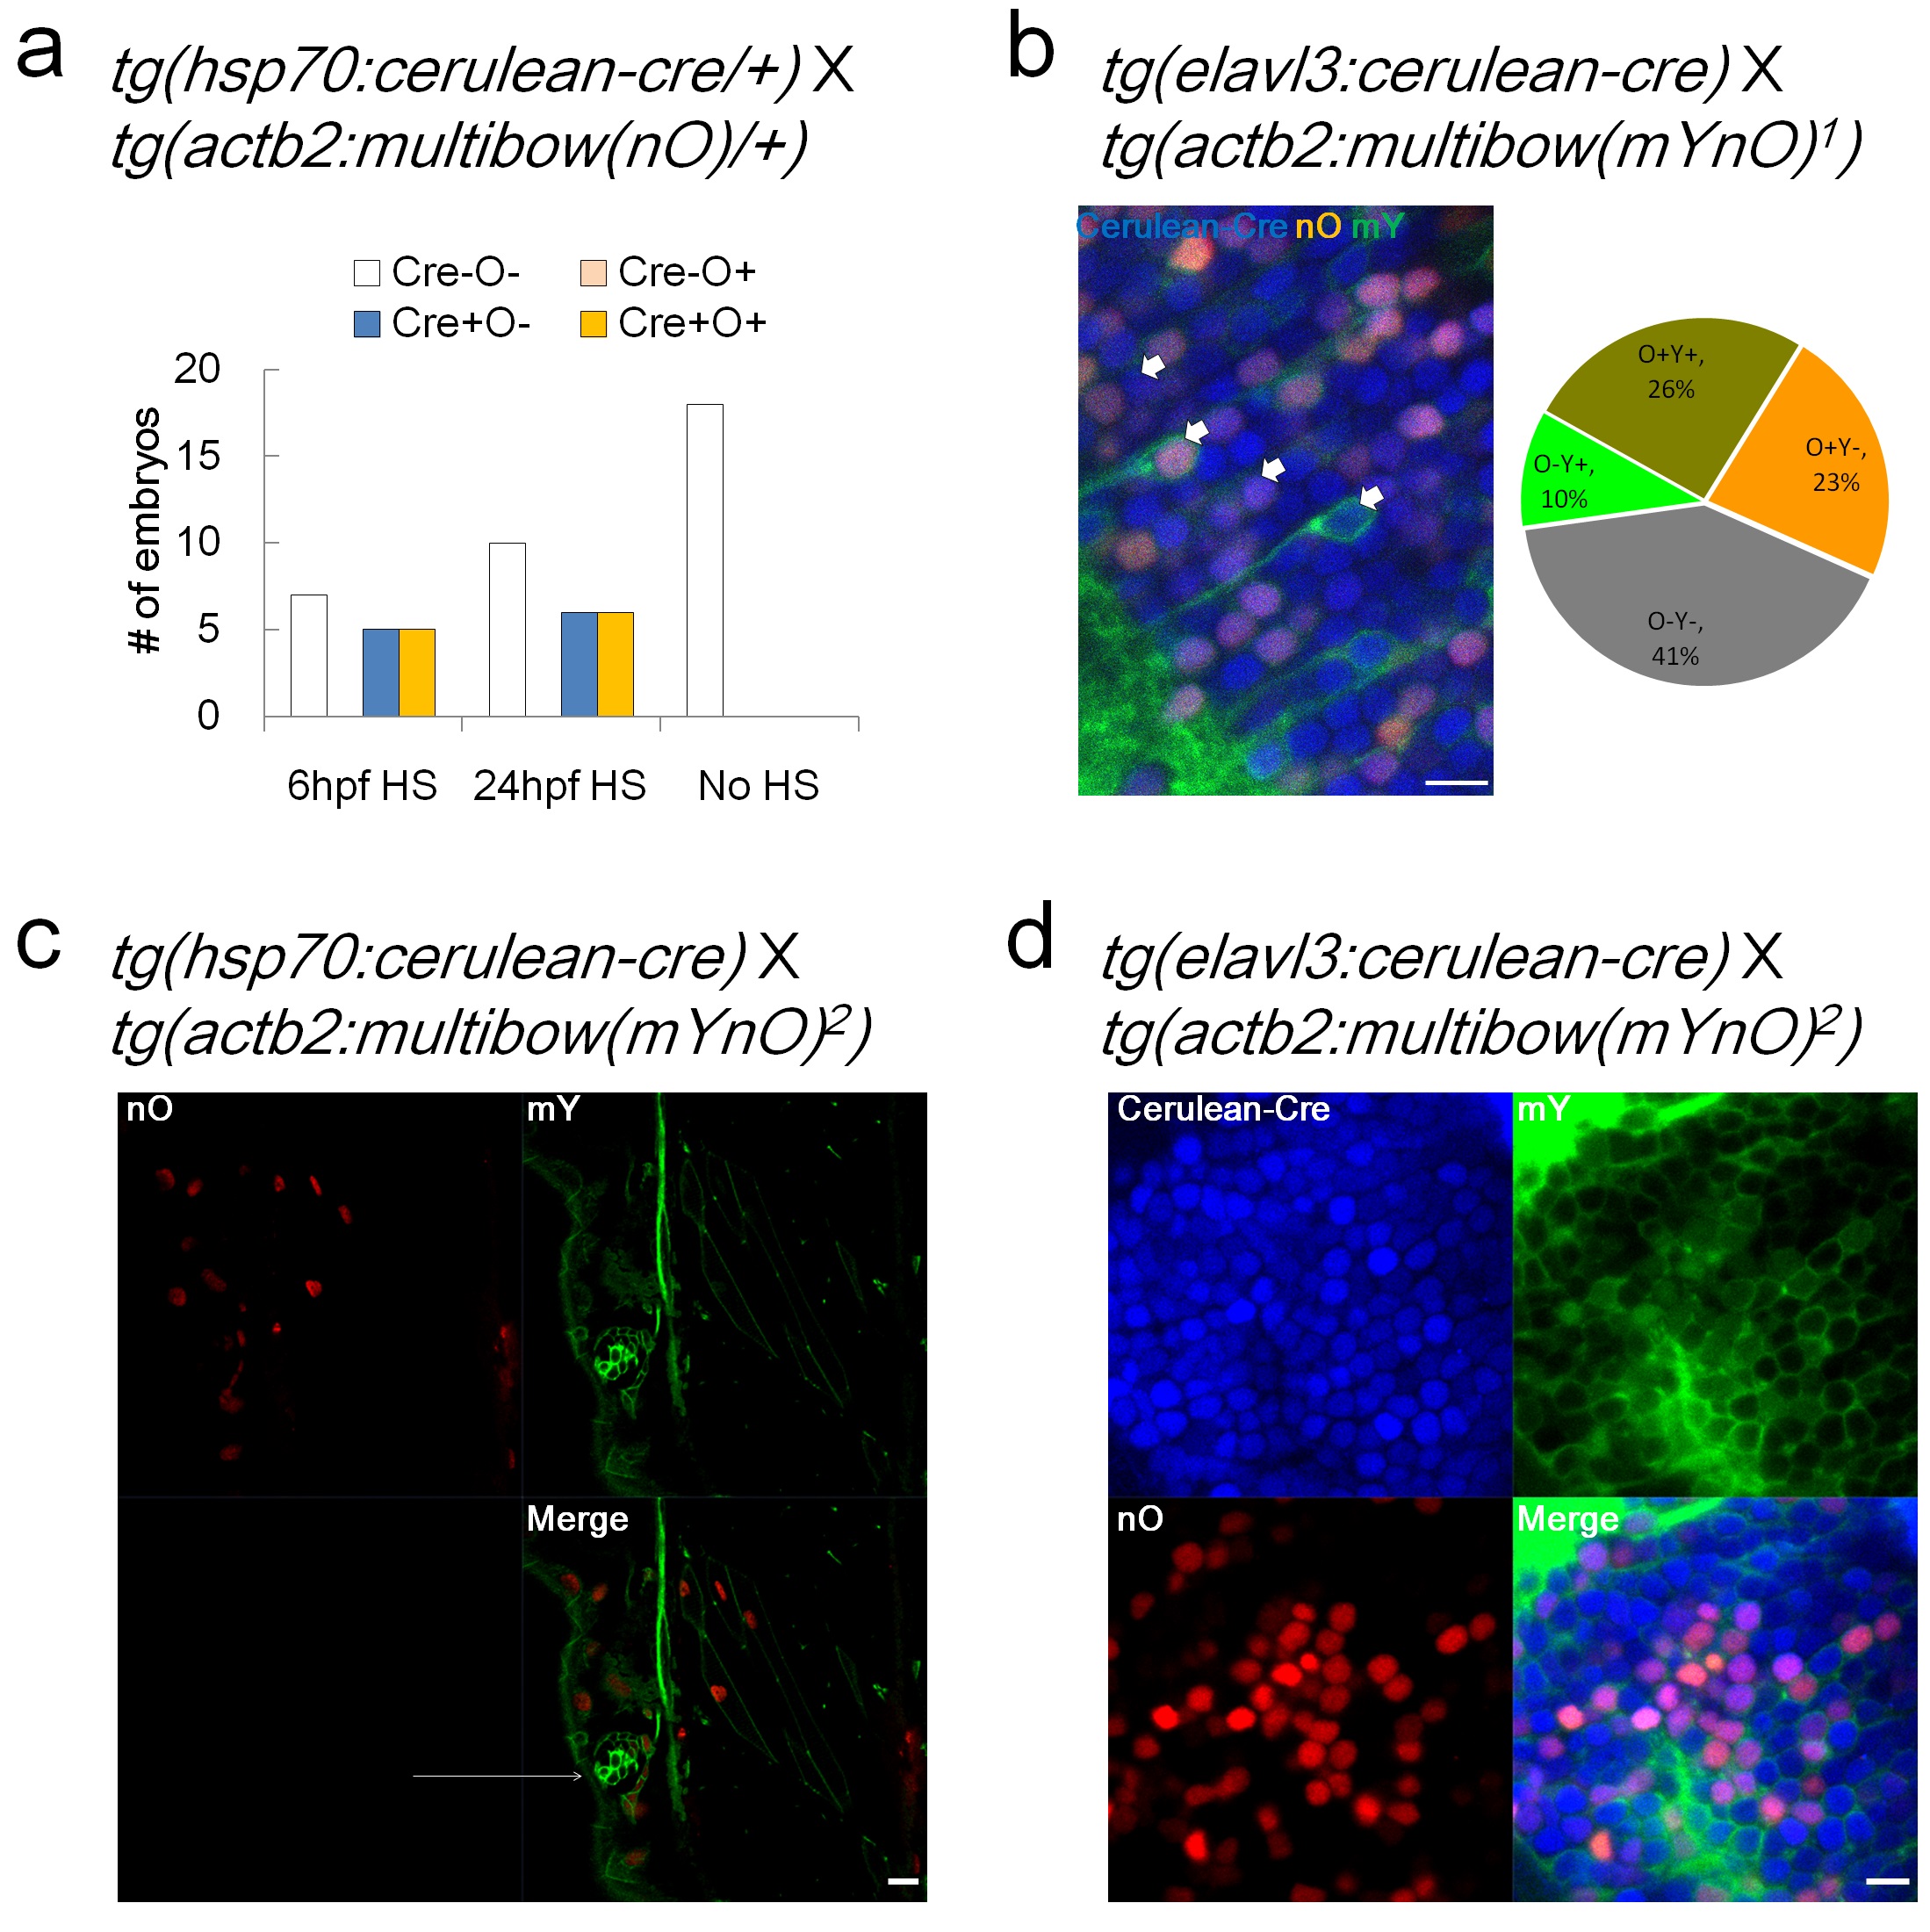
Analysis of Multibow Transgenic Lines.
a. Validation of a single color Multibow line (tg(actb2:multibow(nO)/+)). Multibow transgenic lines were crossed with a Cre driver line as indicated on the top (Same for following panels). Multibow cells were scored to determine the onset of Multibow labeling after Cre addition and distribution of color codes. HS, heat-shock at indicated times (duration: 3 hours). b. A double color Multibow line (tg(actb2:multibow(mYnO)1)) showing ~60% cell coverage and bias towards more nO+ cells. Superscript indicates line number from independent founders. Arrows, example of each of the 4 color codes. Image is a lateral confocal slice of the hindbrain, 2dpf. All scale bars: 10µm. c. Another double color Multibow line (tg(actb2:multibow(mYnO)2)) showing mY+ cells cover all nO+ cells, the code of mY/nO+ is lost in this line. Arrows: mY+/nO- cells. Image is a lateral confocal slice of the trunk, 2dpf, heat-shocked at 12hpf. d. This line (same as in panel c.) shows very strong coverage of mY+ cells (few mY- cells when Cre expression is constitutive), reducing diversity of color codes. Image is a lateral optical slice of the brain, 2dpf.