
|
Fig. 3
Examples of Multibow Cell Tracing in Development and Regeneration.
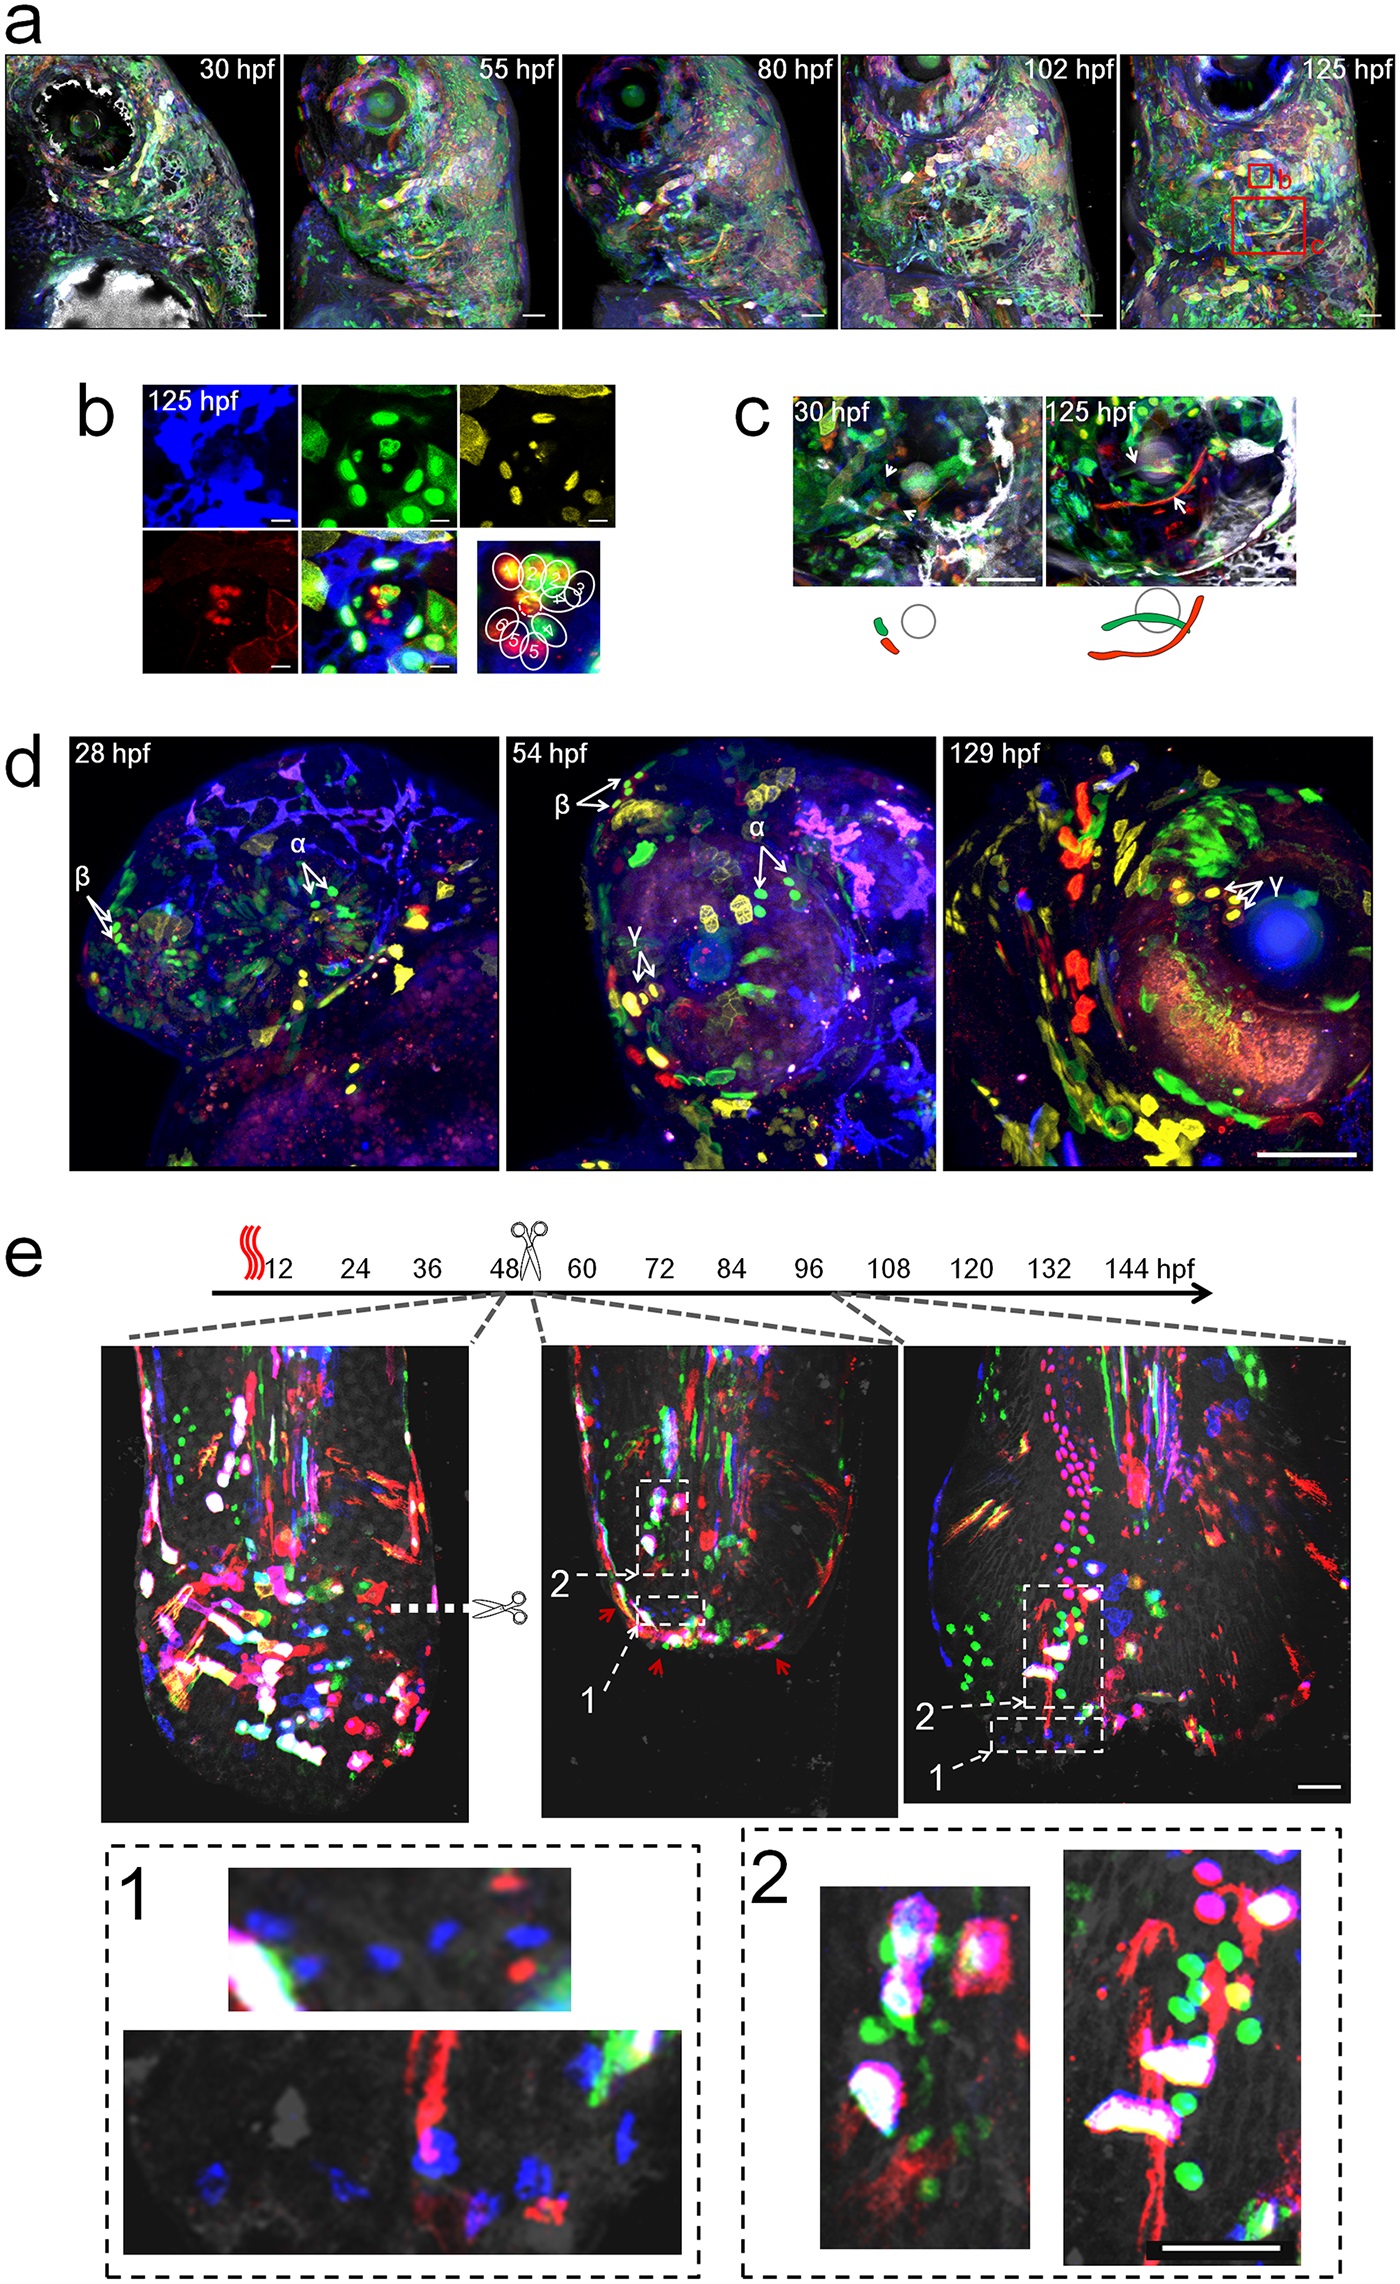
a. Cranial facial development mapped by Multibow. The embryo was heat-shocked at 6hpf. 4 channels (B/G/Y/R) were used. The left face of the larva was imaged. Red boxes: regions highlighted in b. and c.. Scale bars: 50µm. b. Lineage relationship between neuromast hair cells. Dashed line circle indicates the hair bundle. Multibow labeled hair cell color codes: 1(mB/nY/R), 2(mB/mG/nR), 3(mB), 4(nG), 5(mB/nR), 6(R). The same pattern was already observed at 30hpf. Scale bars: 10µm. c. Identification of cells that undergo remarkable morphological changes during semicircular canal formation. Arrows: initial locations of the two mesenchymal cells that span the projection later. Grey circle: posterior otolith. Scale bars: 50µm. d. Clonal expansion near the eye over long time periods. The embryo was injected with 12 constructs (B/G/Y/R) and heat-shocked at 10hpf. Arrows indicate locations of identified clones α (nG), β (nG/R), γ (nY/mR). These clones can be seen amplified in number at 54hpf or 129hpf (α: 2 to 4; β: 2 to 4; γ: 2 to 3). Scale bar: 100µm. e. Multibow analysis of regeneration in the larval tail. Heat-shock labeling (1 hour), amputation and imaging were performed as labeled in the timeline. Immediately after amputation, the tissue shrank and cells near the wound converged (the images overlay may appear to be slightly out of register due to the changes of the live tissue during the acquisition of different channels, cell identification is not affected as these changes are small and predictable). By 2 days after amputation, most cells that had converged at the frontier of the wound were gone (their unique color codes disappeared, red arrowheads). The regenerated tissue came from clonal expansion of cells away from the frontier (highlighted examples in enlarged view from the white boxes 1 and 2). These clones show lineage restriction to the original cell type (the morphology of cells in the same clone remains similar, e.g., the blue cells in box 1 increased in number while size and shape do not have major changes.). Scale bars: 50µm.