
Image
|
Figure Caption
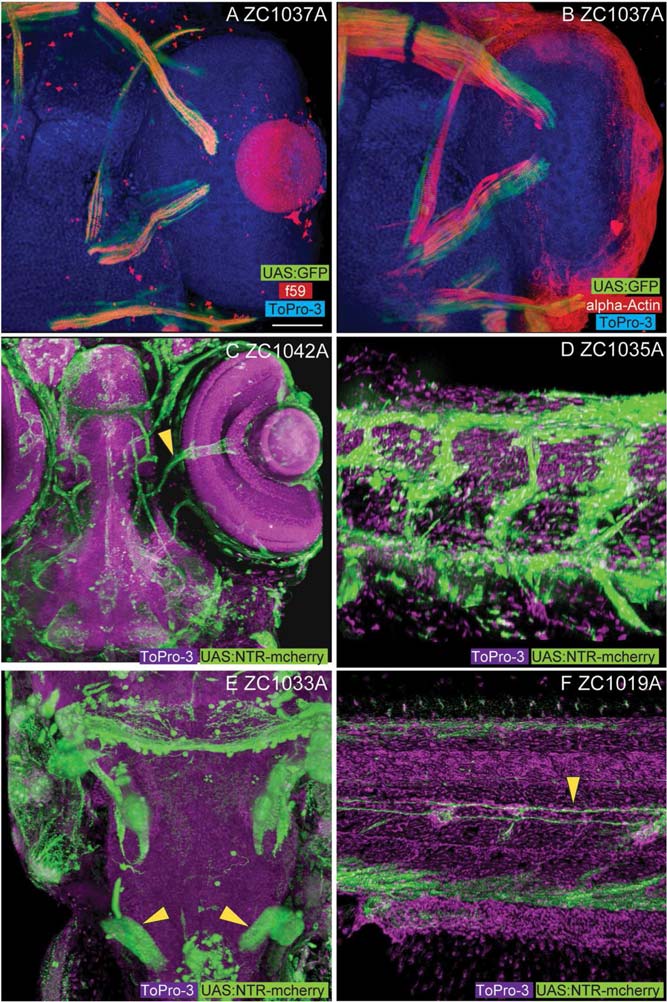
Fig. 6
Non-CNS enhancer trap expression patterns. Among the non-CNS tissues represented in our screen, line zc1037A shows expression in slow (A, f59 positive) but not fast (B, alpha-actin) extraocular myofibers. Vascular expression is visible in both the head (C, arrowhead marks central retinal vessels, zc1042A) and body (D, zc1035A). E: Labeling of the developing pronephros (arrowheads) is visible in line zc1033A. F: Labeling of lateral line glial fibers (arrowhead) is visible in line zc1019A. Images A, B, C, and E show dorsal views. Images D and F show lateral views. Scale bar = 50 µm in A–F.
Figure Data
Acknowledgments
This image is the copyrighted work of the attributed author or publisher, and
ZFIN has permission only to display this image to its users.
Additional permissions should be obtained from the applicable author or publisher of the image.
Full text @ Dev. Dyn.