
Image
|
Figure Caption
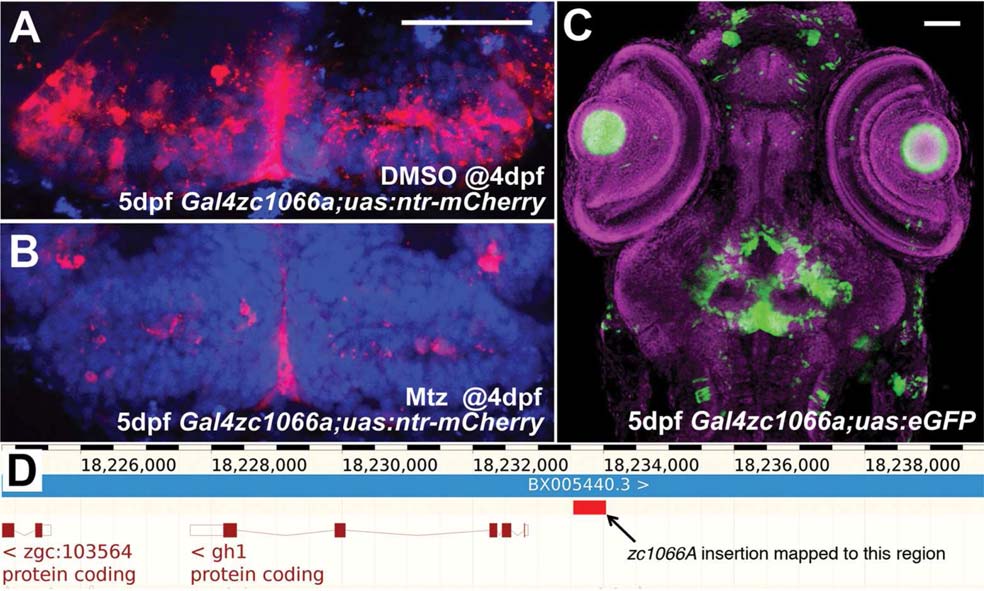
Fig. 5
Use and characterization of a single enhancer trap line. A: Line zc1066a drives expression of NTR-mCherry in hypothalamic radial glia. B: Following incubation in metronidazole for 24 h, most mCherry+ cells are ablated and only debris remains. C: A confocal projection through the entire head of a zc1066a embryo at 5 dpf shows the specificity of this enhancer trap expression pattern. D: Using inverse-PCR, we have mapped the insertion to a genomic region immediately upstream of the gh1 mRNA. Scale bars = 50 µm.
Figure Data
Acknowledgments
This image is the copyrighted work of the attributed author or publisher, and
ZFIN has permission only to display this image to its users.
Additional permissions should be obtained from the applicable author or publisher of the image.
Full text @ Dev. Dyn.