
Fig. S3
- ID
- ZDB-IMAGE-150708-28
- Publication
- Harrison et al., 2015 - Chemokine-guided angiogenesis directs coronary vasculature formation in zebrafish
- All Figures
- Figures for Harrison et al., 2015
|
Fig. S3
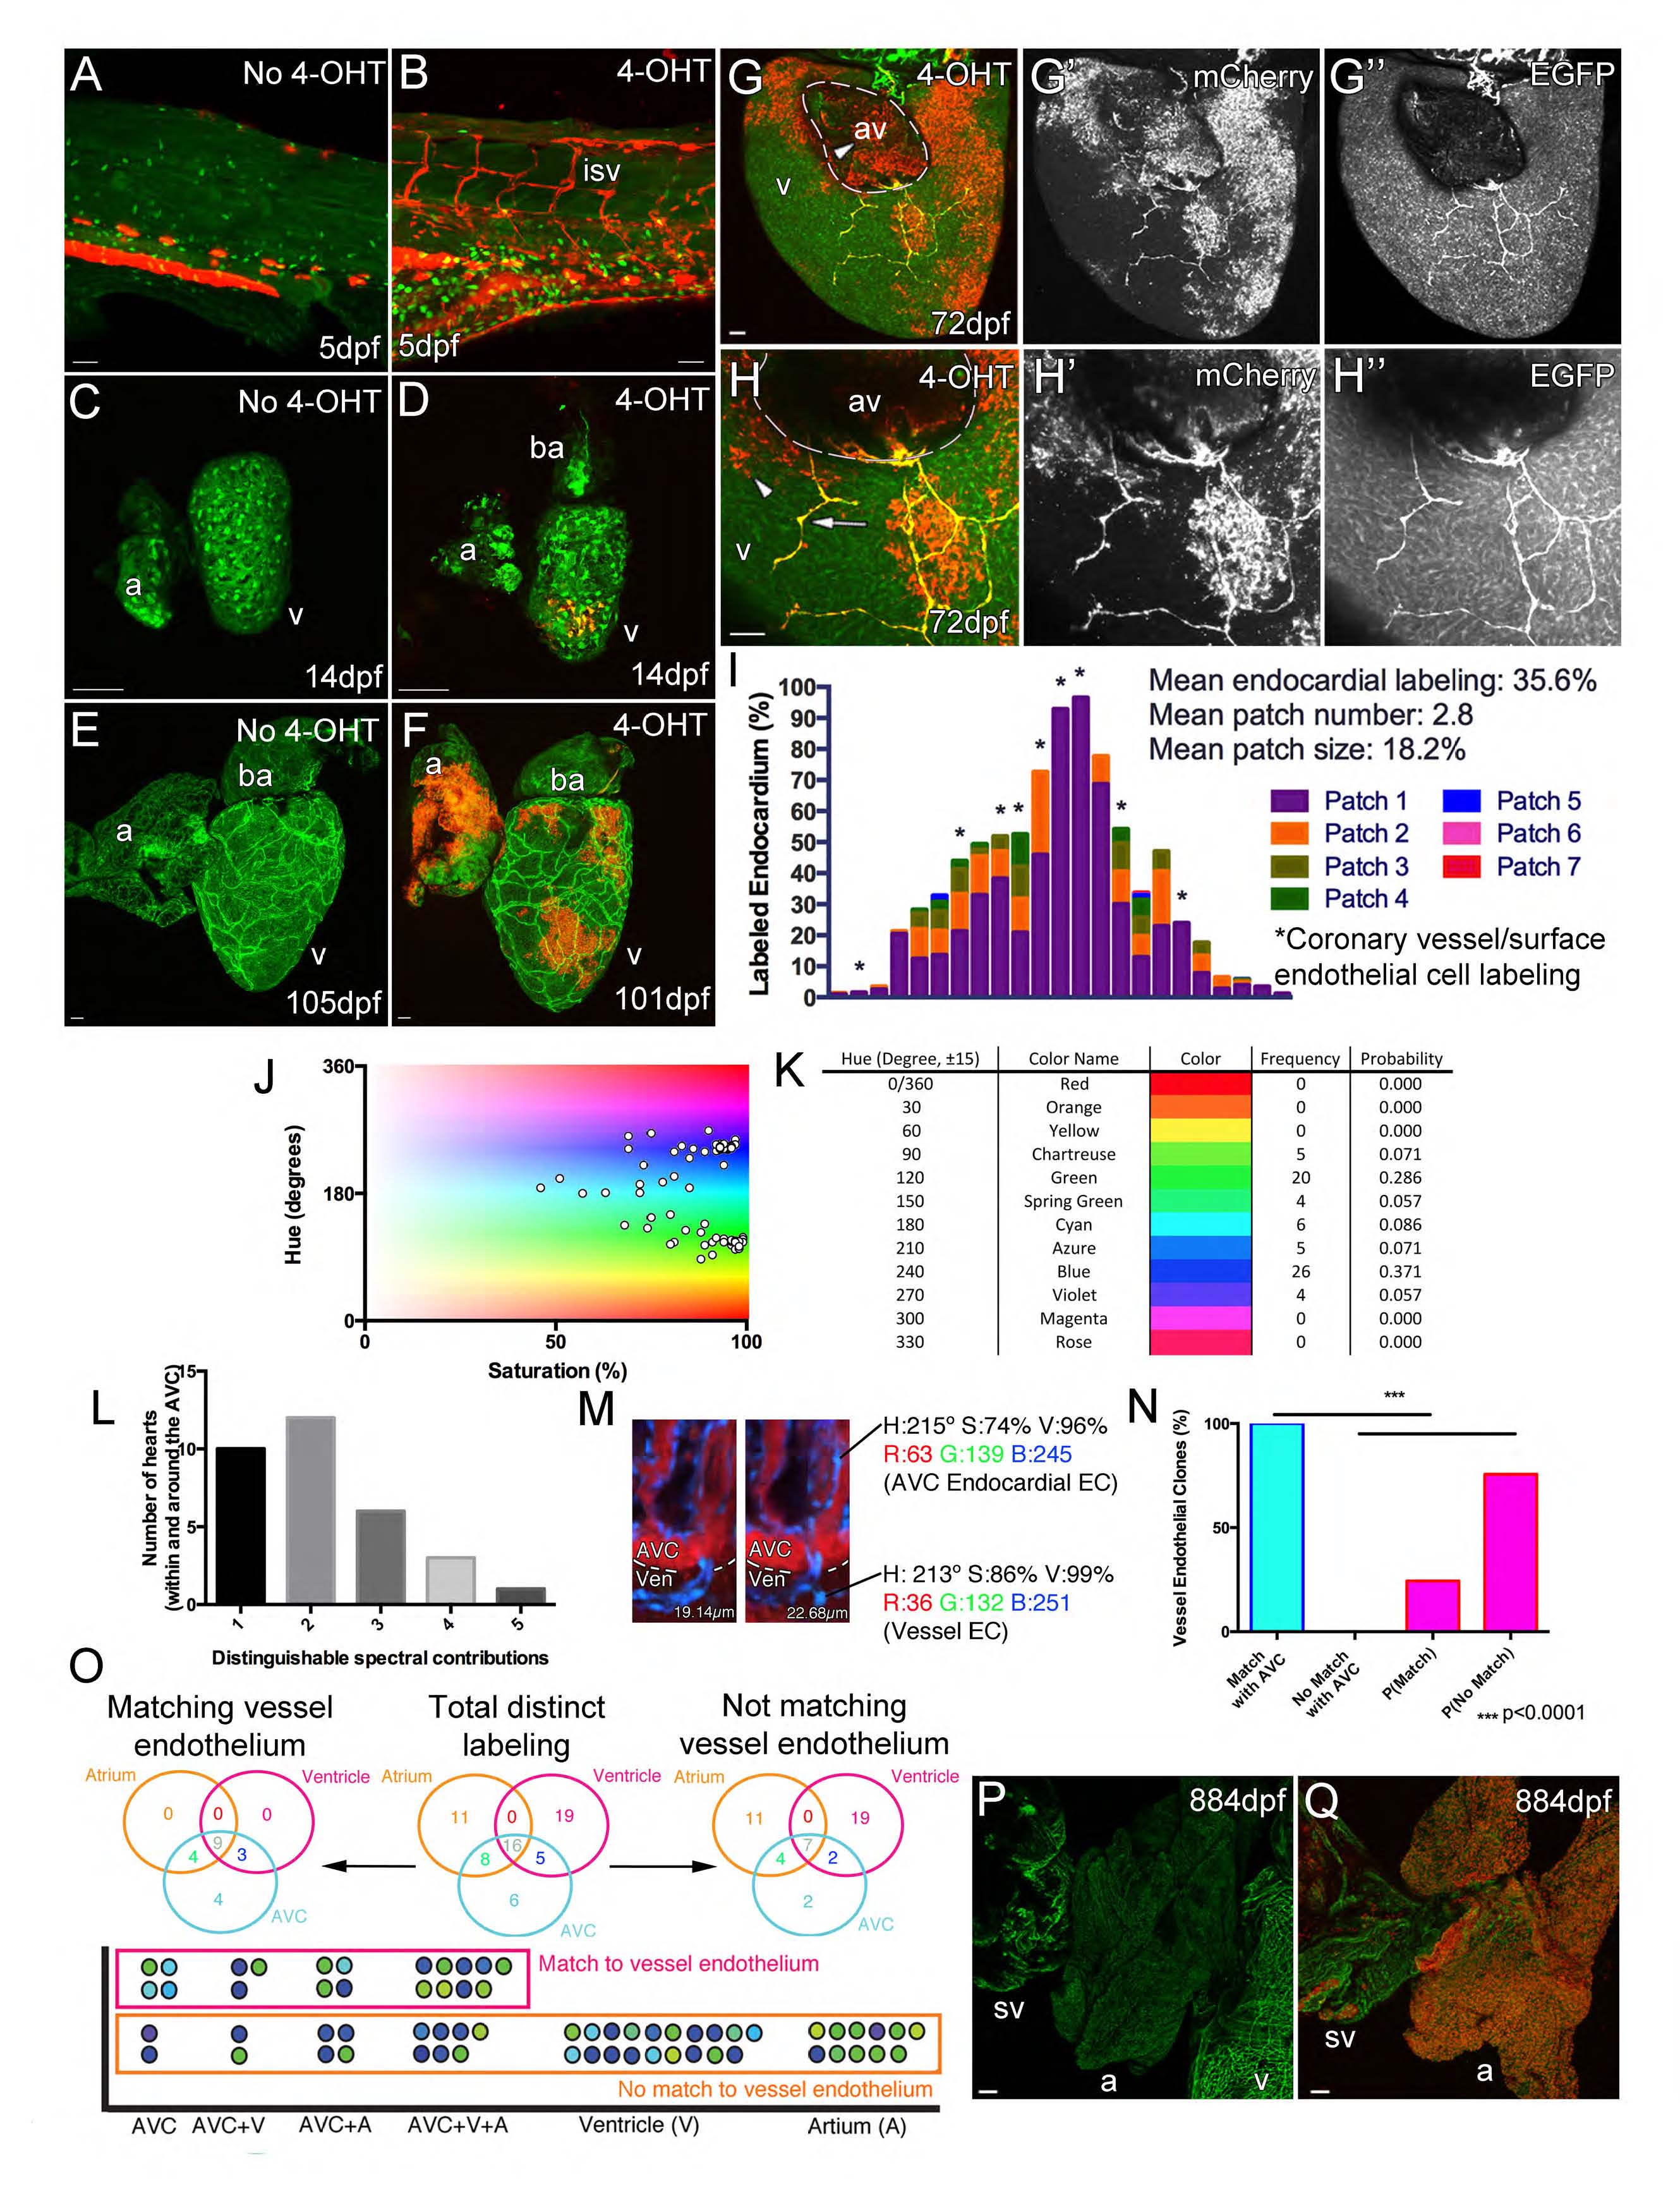
Cell lineage tracing of endocardial cells. (Related to Figure 3)
Cre activity is strictly dependent on 4OHT with no labeled endothelial cells observed in non-4OHT treated embryos (A, red autofluorescence from pigment cells), larval (C) or adult fish (E). Treatment of embryos for 5 days in 4-OHT results in clonal endothelial cell labeling in the embryo (B), larval (D) and adult (F) zebrafish. However, such labeling of the endothelial cells does not always result in the labeling of the later developing coronary vessels indicating that only a subset of endocardial cells contribute to the coronary vasculature (F). In addition, labeling of vessels in 4OHT treated hearts that lack any endocardial labeling has not been observed (n=6). Side view of ventricle at the AV boundary (atrium removed) (G and H, arrowhead, labeled endocardium; arrow, labeled surface vessel; G′ and H′ mCherry, G′′ and H′′ EGFP). Labeled endocardial cells in the AV boundary can be seen proximal to similarly labeled migrating endothelial cells on the ventricle surface. I, Quantification of triple transgenic zebrafish hearts (fli1aep:ERt2CreERt2; fli1a:EGFP; ubb:LoxP-EGFP-LoxPmCherry) exposed to 4-OHT during embryogenesis and imaged at 95 to 155dpf, cumulative proportion of endocardium labeled in 1 to 7 patches (defined as a continuous group of cells). Individual hearts along x-axis, hearts with labeled coronary vessels or surface endothelial cells are marked with asterisk (I). To confirm the contribution from the AVC endocardium, recombination of ubb:Zebrabow (ubb:Lox2272-LoxP-RFP-Lox2272-CFP-LoxP-YFP) was induced in the embryonic endocardium by kdrl:CreERt2 to produce a spectrum of colors which are plotted with respect to their hue and saturation (J). There was limited contribution to the spectrum from the red channel due the relatively weak expression of ubb:Zebrabow in endothelial cells and the imaging limitations due to the adjacent RFP-positive myocardium. Despite this, a range of distinguishable colors was detected with varying frequency (K). An average of 2.2 different colors where found in the regions surrounding the AVC and a maximum of 5 spectral labels were distinguishable within a single heart (L). An example of a color specific to the AVC endocardium that matches that of the vessel endothelium on the ventricle surface, there is also a direct connection between these cells (M; relative z position listed for AVC/vessel clone). Even without a full spectrum of color labeling the spectral matching of AVC endocardium with vessel endothelial cells is significantly higher than expected at random (N, Probability of randomly matching colors [P(Match)] is 24.4%, p<0.0001). Positional distribution of distinct spectral contributions shows that many are shared between different heart regions, but only those that label AVC endocardium match the labeling observed in vessel endothelial cells (O). The different spectral contributions are represented as a circle each of which is positioned with respect to their location within the endocardium of the heart (O). Colors that match those of the vessel endothelium on the ventricle surface are grouped together in the pink box; those that do not appear to match are below in the orange box (O). Unlike single-channel analysis, for multispectral analysis only cell spectral contribution is scored and not relative cell positioning (i.e. whether or not cells form a contiguous patch). Vessel density is defined as a ratio of this vessel area to total pixel area of a defined region. The positioning of the emerging sprouts from the AVC endocardium is consistent with the pattern of vascularization observed in older zebrafish hearts, which lack vessels on the surface of the atrium and sinus venous (sv, fli1a:EGFP) (P). Unlike the SV in other organisms studied, the zebrafish SV largely lacks cardiomyocytes (Q, myl7:DsRed2-NLS, red) and has no coronary sinus on its surface (Q, fli1a:EGFP, green; ventricle removed and atrium rotated to reveal SV). Scale bars, 50 µm. isv, intersegmental vessel; a, atrium; v, ventricle; av, AV canal; and sv, sinus venous.
Reprinted from Developmental Cell, 33, Harrison, M.R., Bussmann, J., Huang, Y., Zhao, L., Osorio, A., Burns, C.G., Burns, C.E., Sucov, H.M., Siekmann, A.F., Lien, C.L., Chemokine-guided angiogenesis directs coronary vasculature formation in zebrafish, 442-54, Copyright (2015) with permission from Elsevier. Full text @ Dev. Cell