Image


                        Figure Caption


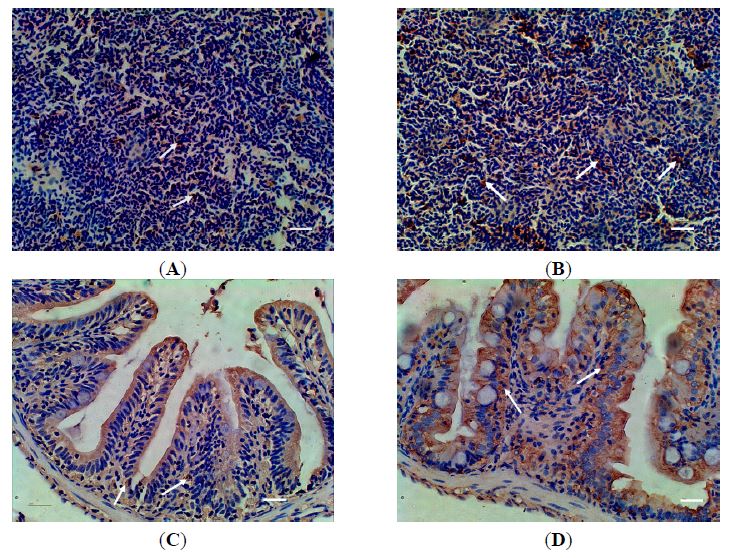
Fig. 5 Distribution of MR in spleen and intestine of zebra fish detected with Immunohistochemistry after Aeromonas sobria infection. (A) spleen of control fish; (B) spleen of infected fish; (C) intestine of control fish; (D) intestine of infected fish; White arrows indicated positive signal. Scale bar = 20 µm.
                
                    
                        Figure Data


                        Acknowledgments


This image is the copyrighted work of the attributed author or publisher, and
ZFIN has permission only to display this image to its users.
Additional permissions should be obtained from the applicable author or publisher of the image.
      Full text @ Int. J. Mol. Sci.


        