
|
Fig. 5
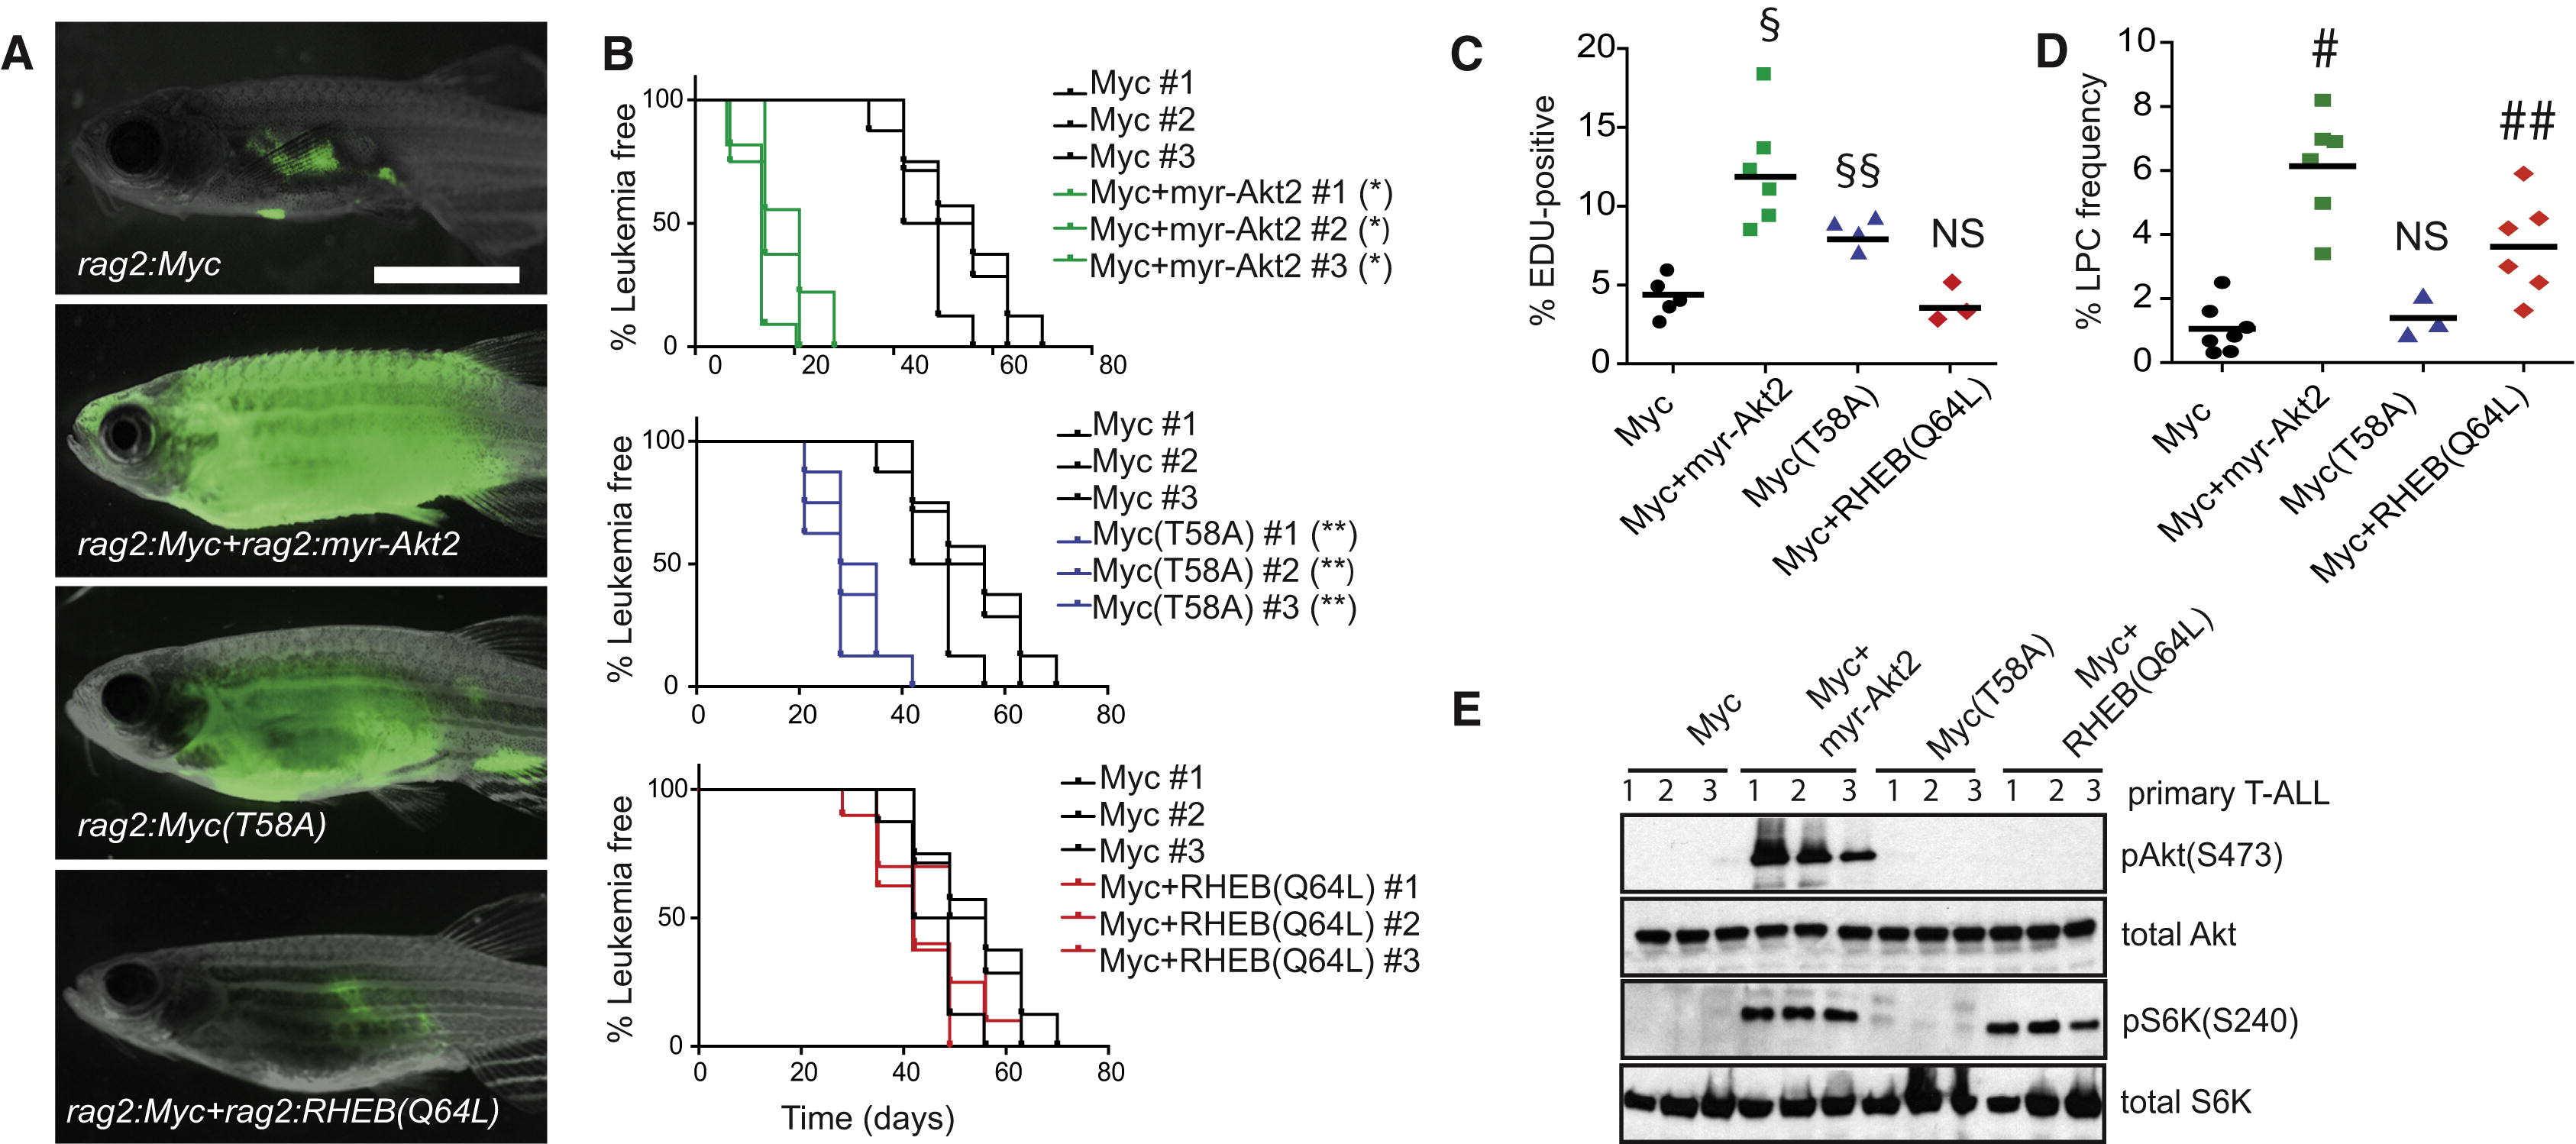
The Akt Pathway Increases LPC Frequency through Downstream Activation of mTORC1 and Shortens Latency by Augmenting Myc Stability
(A) Representative images of zebrafish that were transplanted with 25 LPCs from T-ALL expressing GFP and the indicated constructs (three T-ALL per genotype, n = 35 animals transplanted per primary leukemia) at 28 days posttransplantation.
(B) Kaplan-Meier analyses of time to T-ALL regrowth for each genotype and compared to Myc alone expressing T-ALL. Denotes a significant difference in latency of p < 0.0001. Indicates a significant difference in latency of p = 0.003.
(C) EDU analysis of transgenic T-ALL. Each datum point represents the percent EDU-positive cells for one T-ALL. §Represents a significant difference of p < 0.0001. §§Denotes a significant difference of p = 0.004, when compared to Myc alone expressing T-ALL. NS, no significant difference.
(D) Graph showing LPC frequency within each transgenic group. Each point represents data for one primary T-ALL. #Denotes a significant difference in LPC frequency of p < 0.0001. ##Indicates a significant difference in LPC frequency of p = 0.0025 when compared to Myc alone expressing T-ALL. NS, no significant difference.
(E) Western blot analysis.
See also Figure S5 and Table S4.
Reprinted from Cancer Cell, 25, Blackburn, J.S., Liu, S., Wilder, J.L., Dobrinski, K.P., Lobbardi, R., Moore, F.E., Martinez, S.A., Chen, E.Y., Lee, C., Langenau, D.M., Clonal evolution enhances leukemia-propagating cell frequency in T cell acute lymphoblastic leukemia through Akt/mTORC1 pathway activation, 366-78, Copyright (2014) with permission from Elsevier. Full text @ Cancer Cell