
|
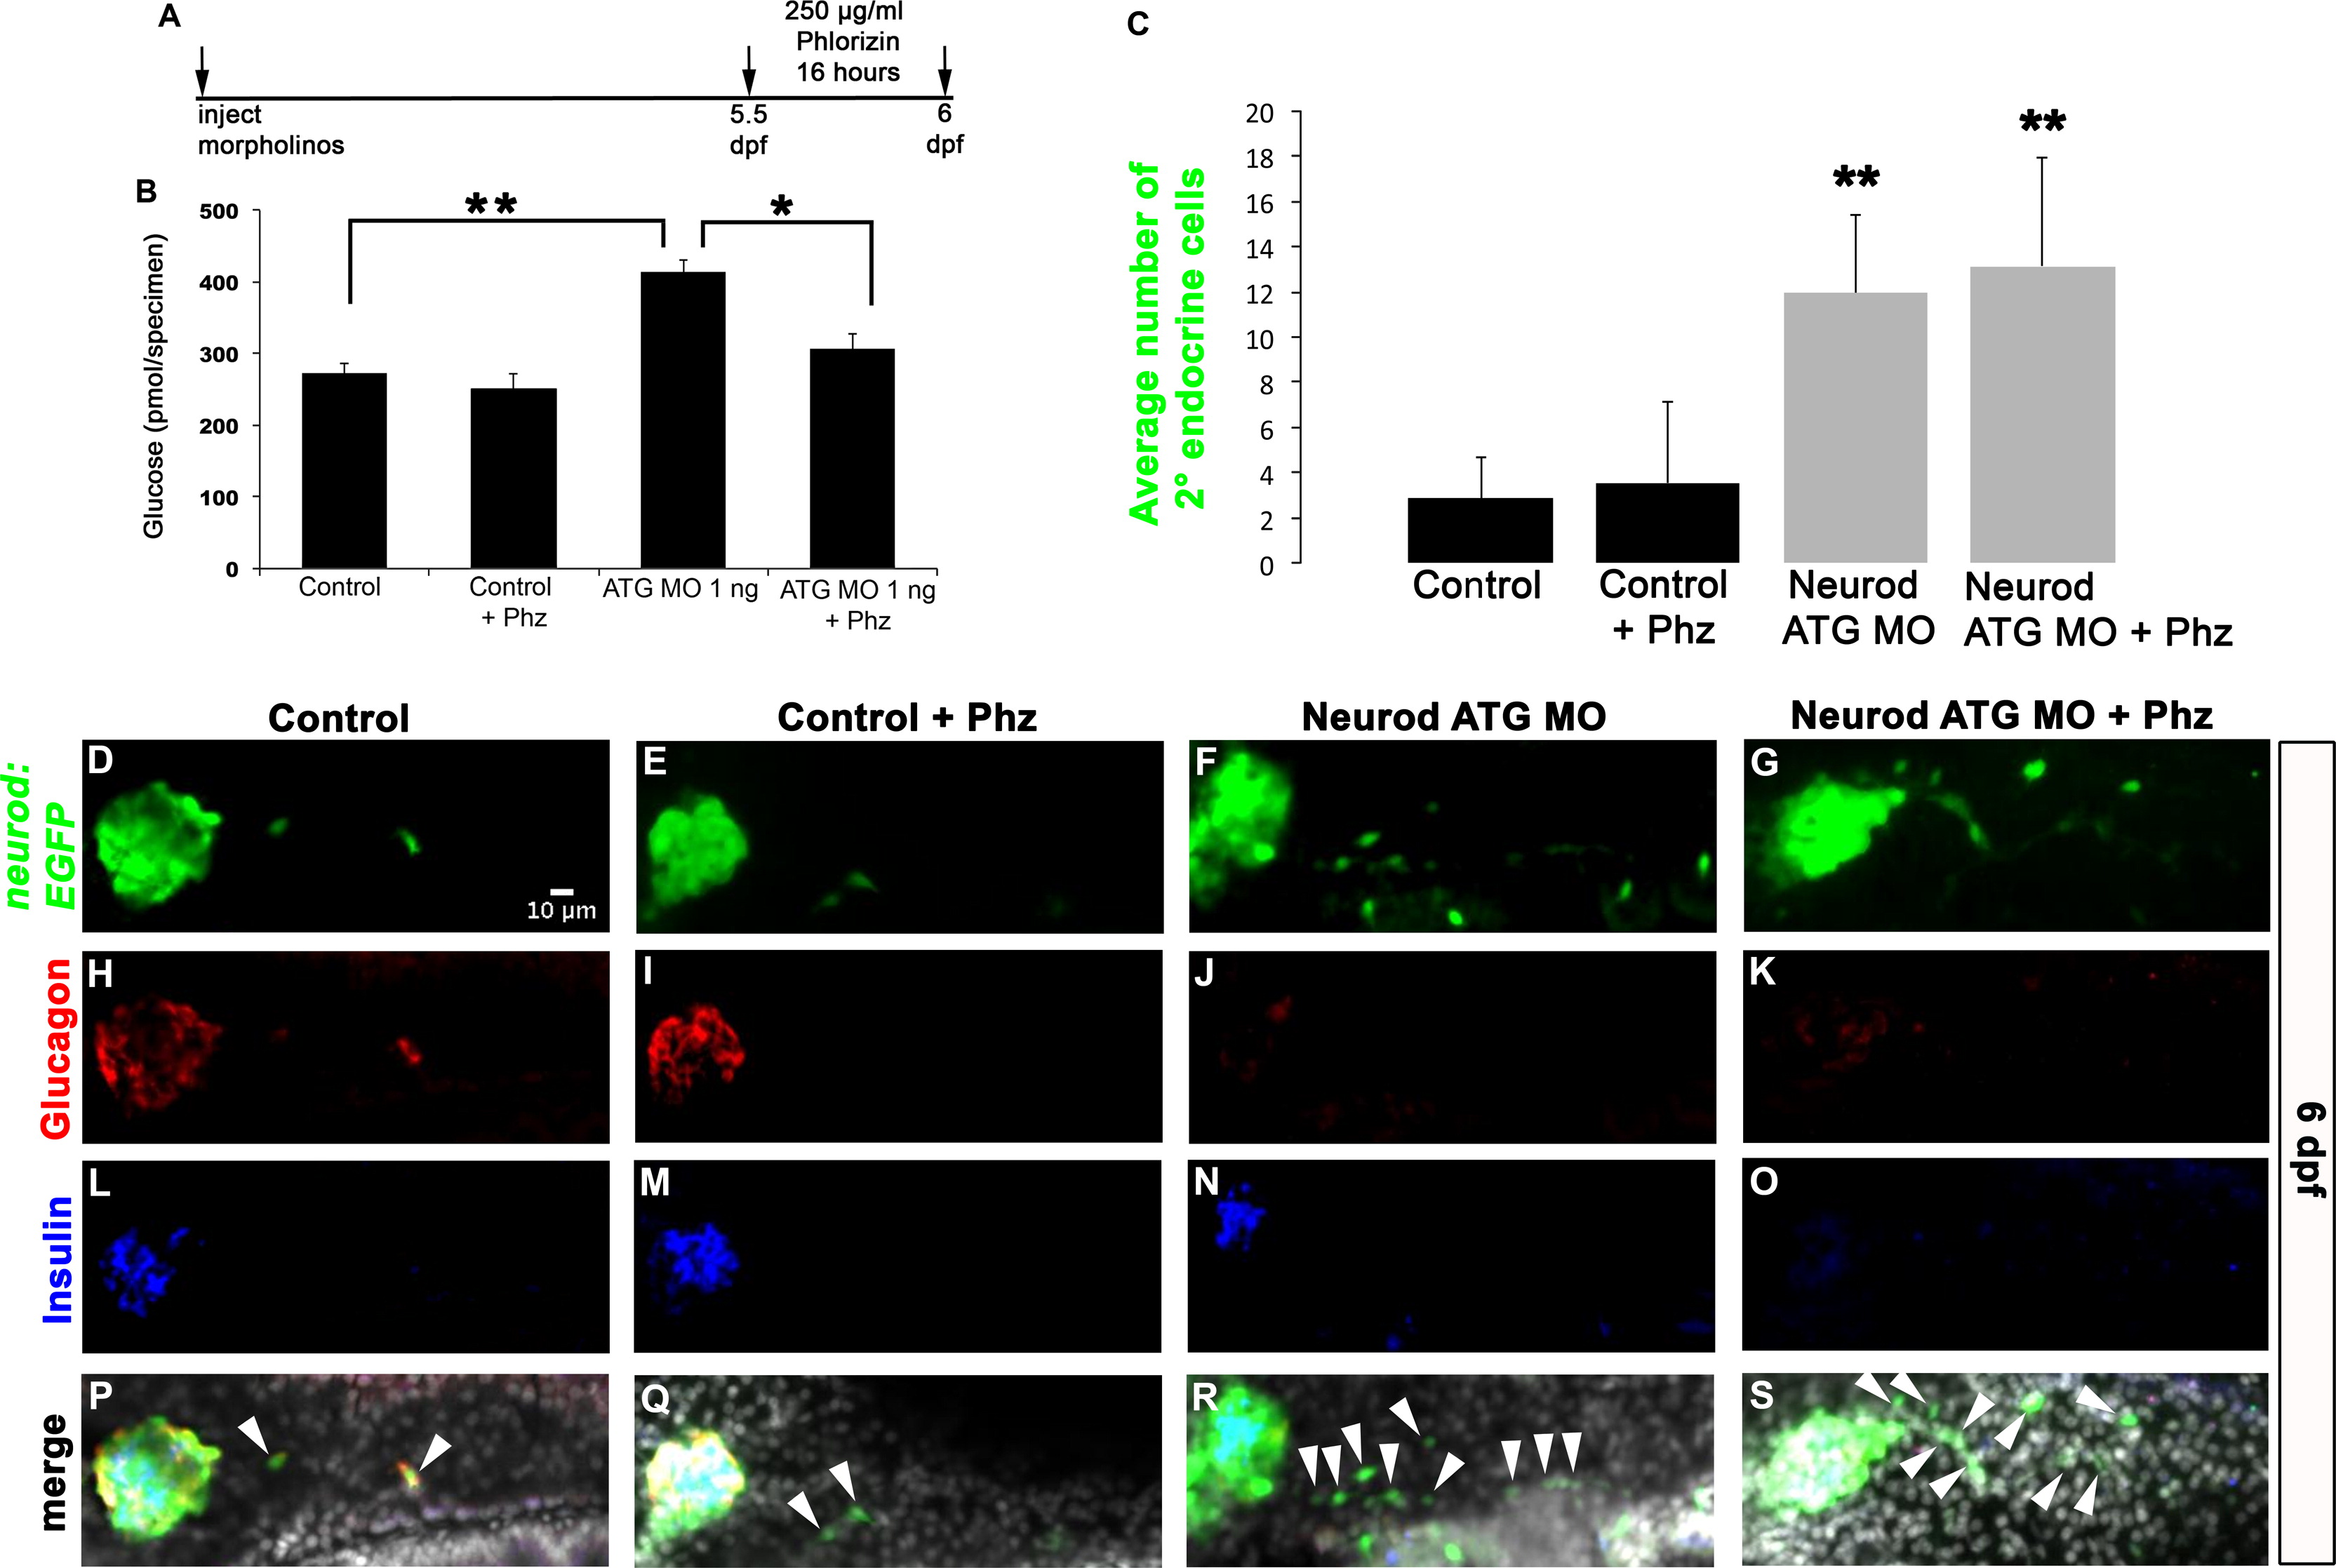
Fig. 9
Neurod morphants treated with sodium glucose cotransporter inhibitor retain increased production of secondary endocrine cells. (A) Experimental schedule. 1 ng of Neurod ATG MO injected Tg(neurod:EGFP) specimens were treated with 250 µg/ml Phloridzin (Phz) at 5.5 dpf for 16 h and collected for free glucose assay. (B) Free glucose levels in 6 dpf Tg(neurod:EGFP) untreated and Phz treated control and Neurod morphant specimens. Phz treatment normalized glucose levels in Neurod morphants. Mean (±s.e.m) glucose levels from 4 independent experiments. (C) Mean (±s.d.) number of cells expressing GFP-positive secondary endocrine cells from 4 independent experiments and from a minimum of 16 larvae per group. Confocal images (merged z-stacks) of representative 6 dpf Tg(neurod:EGFP) control (D, H, L, P), control treated with phlorizin (Phz) (E, I, M, Q), Neurod ATG morphant (F, J, N, R) and Neurod ATG morphant treated with Phz (G, K, O, S). Whole mount immunolabeling for GFP (green, D–G), glucagon (red, H–K), insulin (blue, L–O) and merged images with nuclear marker DAPI (P–S). *P<0.007, **P<0.0005; t-test, two-tailed distribution. Secondary endocrine precursor cells; arrowhead. White scale bar=10 µm.
Reprinted from Developmental Biology, 402(1), Dalgin, G., Prince, V.E., Differential levels of Neurod establish zebrafish endocrine pancreas cell fates, 81-97, Copyright (2015) with permission from Elsevier. Full text @ Dev. Biol.