
Image
|
Figure Caption
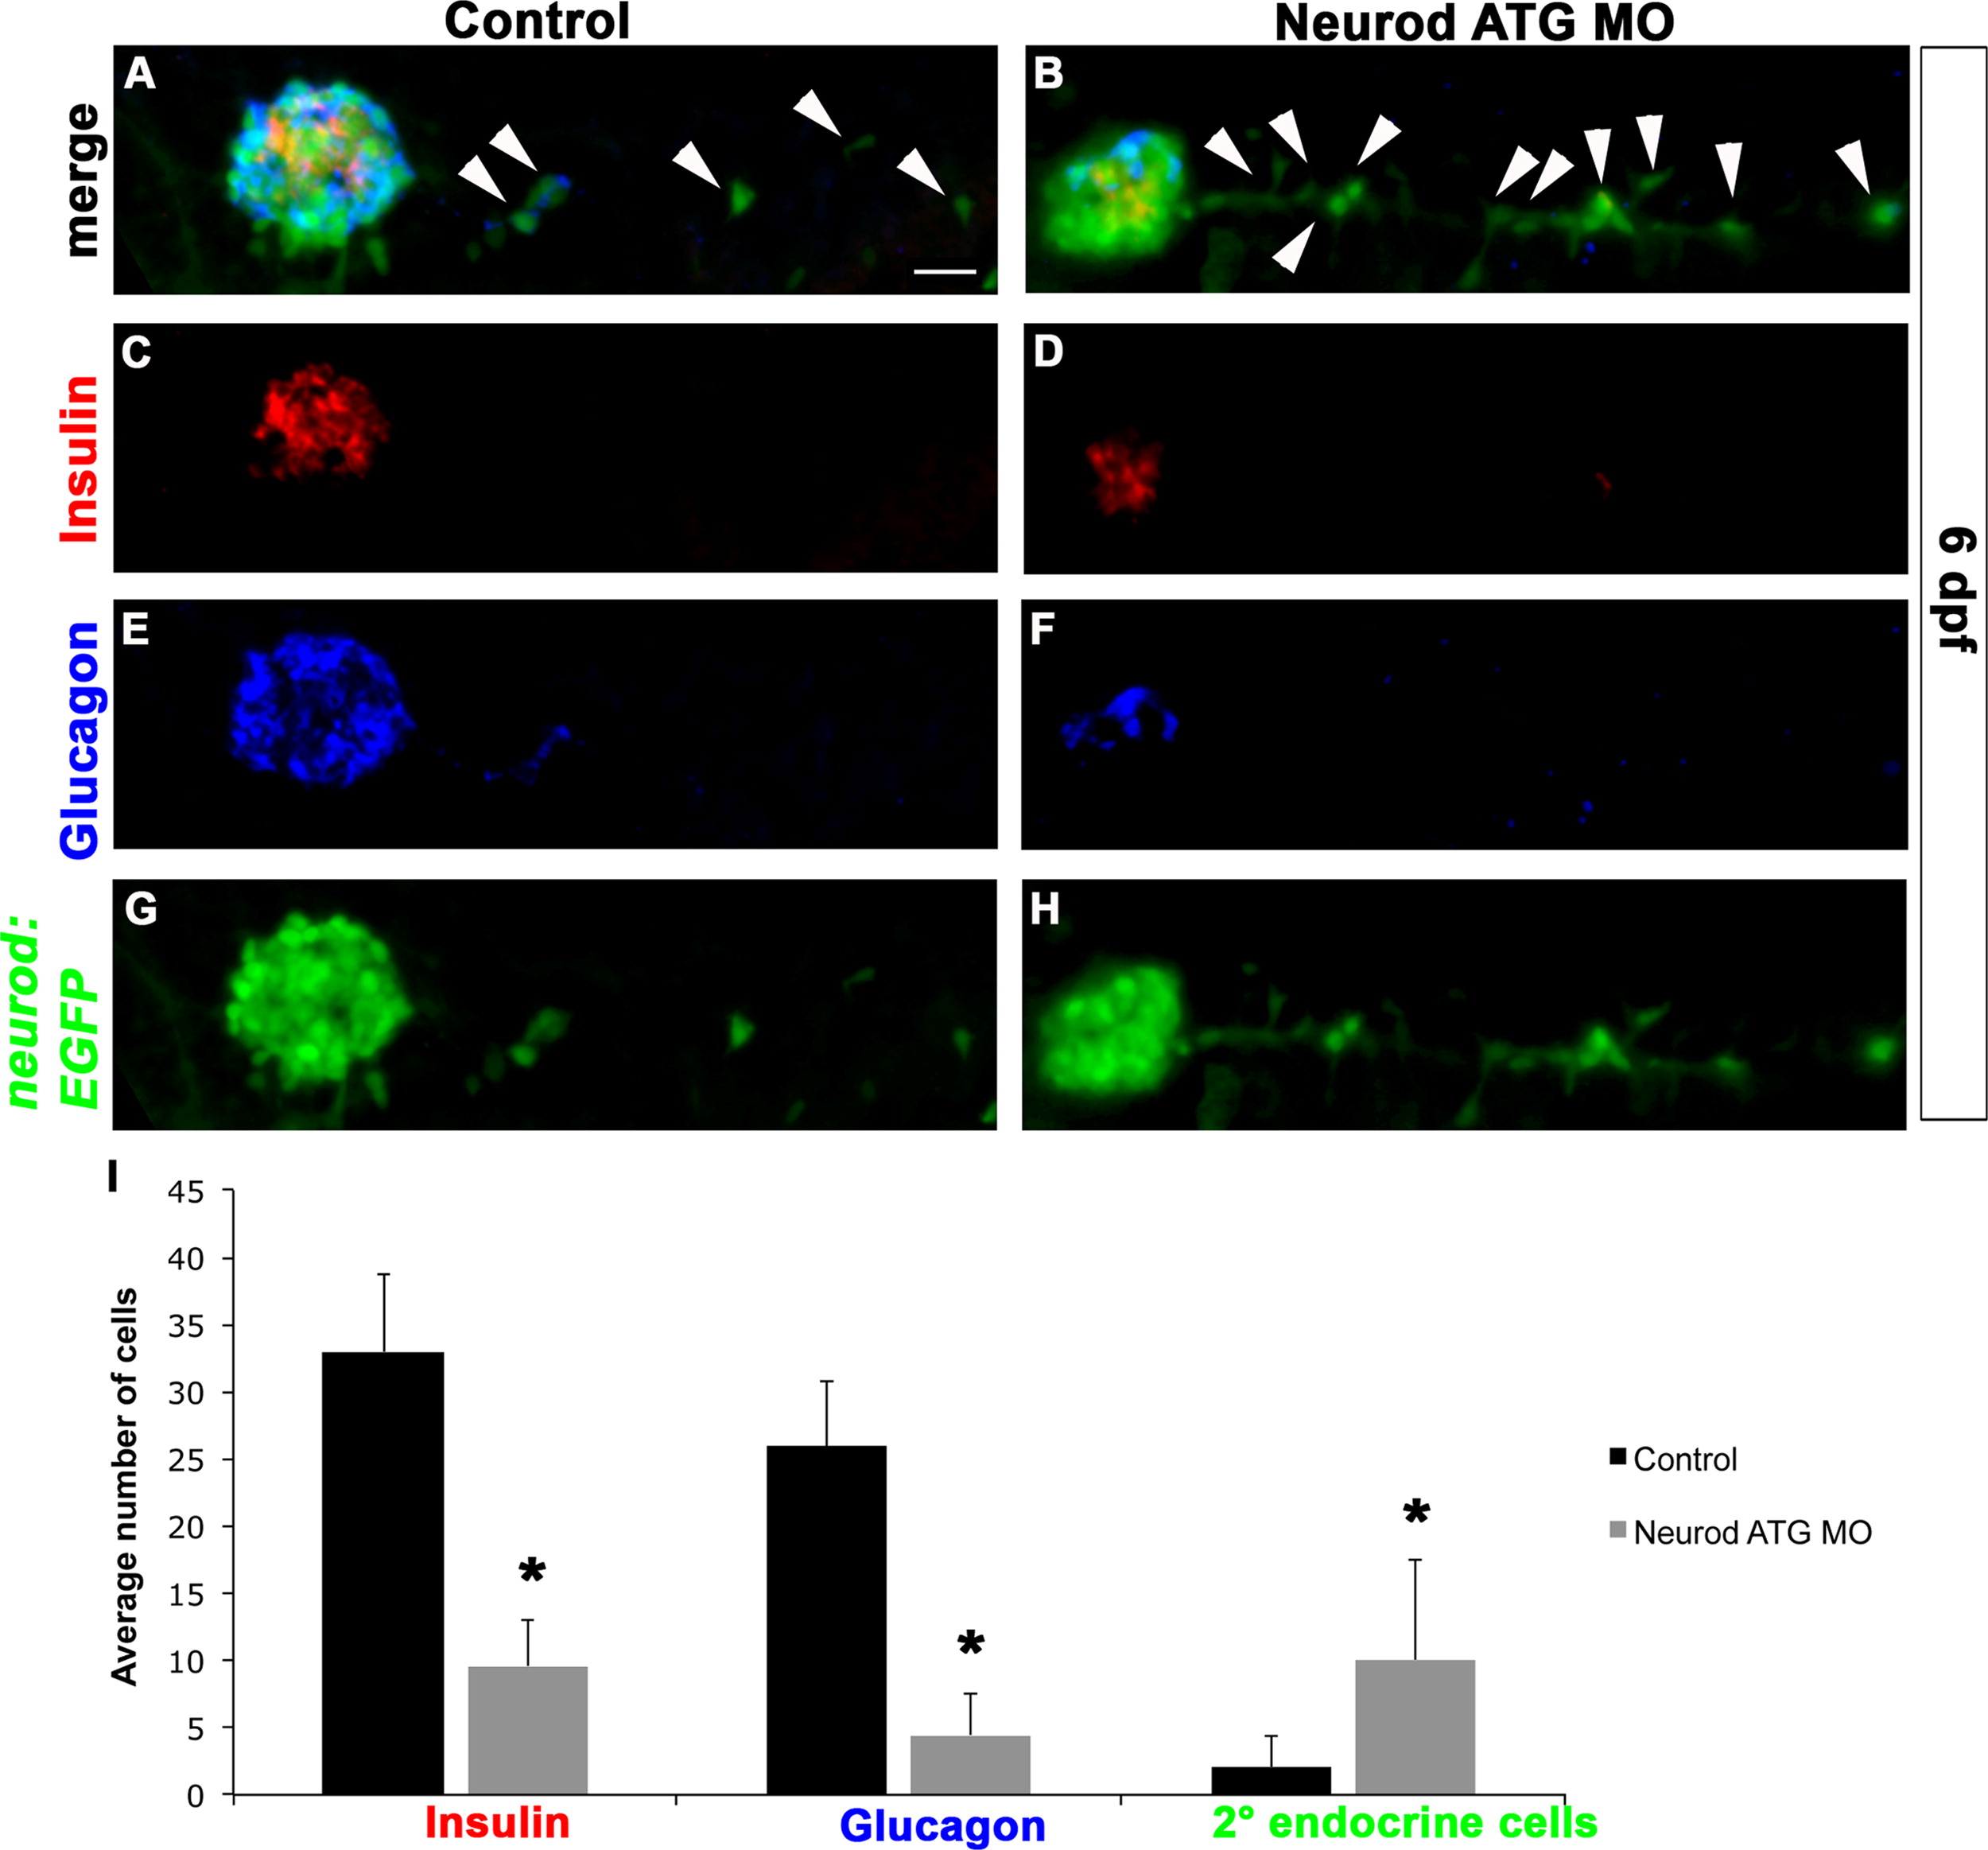
Fig. 7
Neurod knockdown increases production of secondary endocrine precursor cells. Confocal images (merged z-stacks) of representative 6 dpf Tg(neurod:EGFP) Control (A, C, E, G) and Neurod ATG morphant (B, D, F, H) specimens. Whole mount immunolabeling for insulin (C, D), glucagon (E, F) and GFP (G, H). (I) Mean (±s.d.) number of cells expressing insulin, glucagon, GFP-positive secondary endocrine cells from 6 independent experiments and from a minimum of 20 larvae per group. *P<0.0001; t-test, two-tailed distribution. Secondary endocrine precursor cells; arrowhead. Scale bar=20 µm.
Acknowledgments
This image is the copyrighted work of the attributed author or publisher, and
ZFIN has permission only to display this image to its users.
Additional permissions should be obtained from the applicable author or publisher of the image.
Reprinted from Developmental Biology, 402(1), Dalgin, G., Prince, V.E., Differential levels of Neurod establish zebrafish endocrine pancreas cell fates, 81-97, Copyright (2015) with permission from Elsevier. Full text @ Dev. Biol.