
|
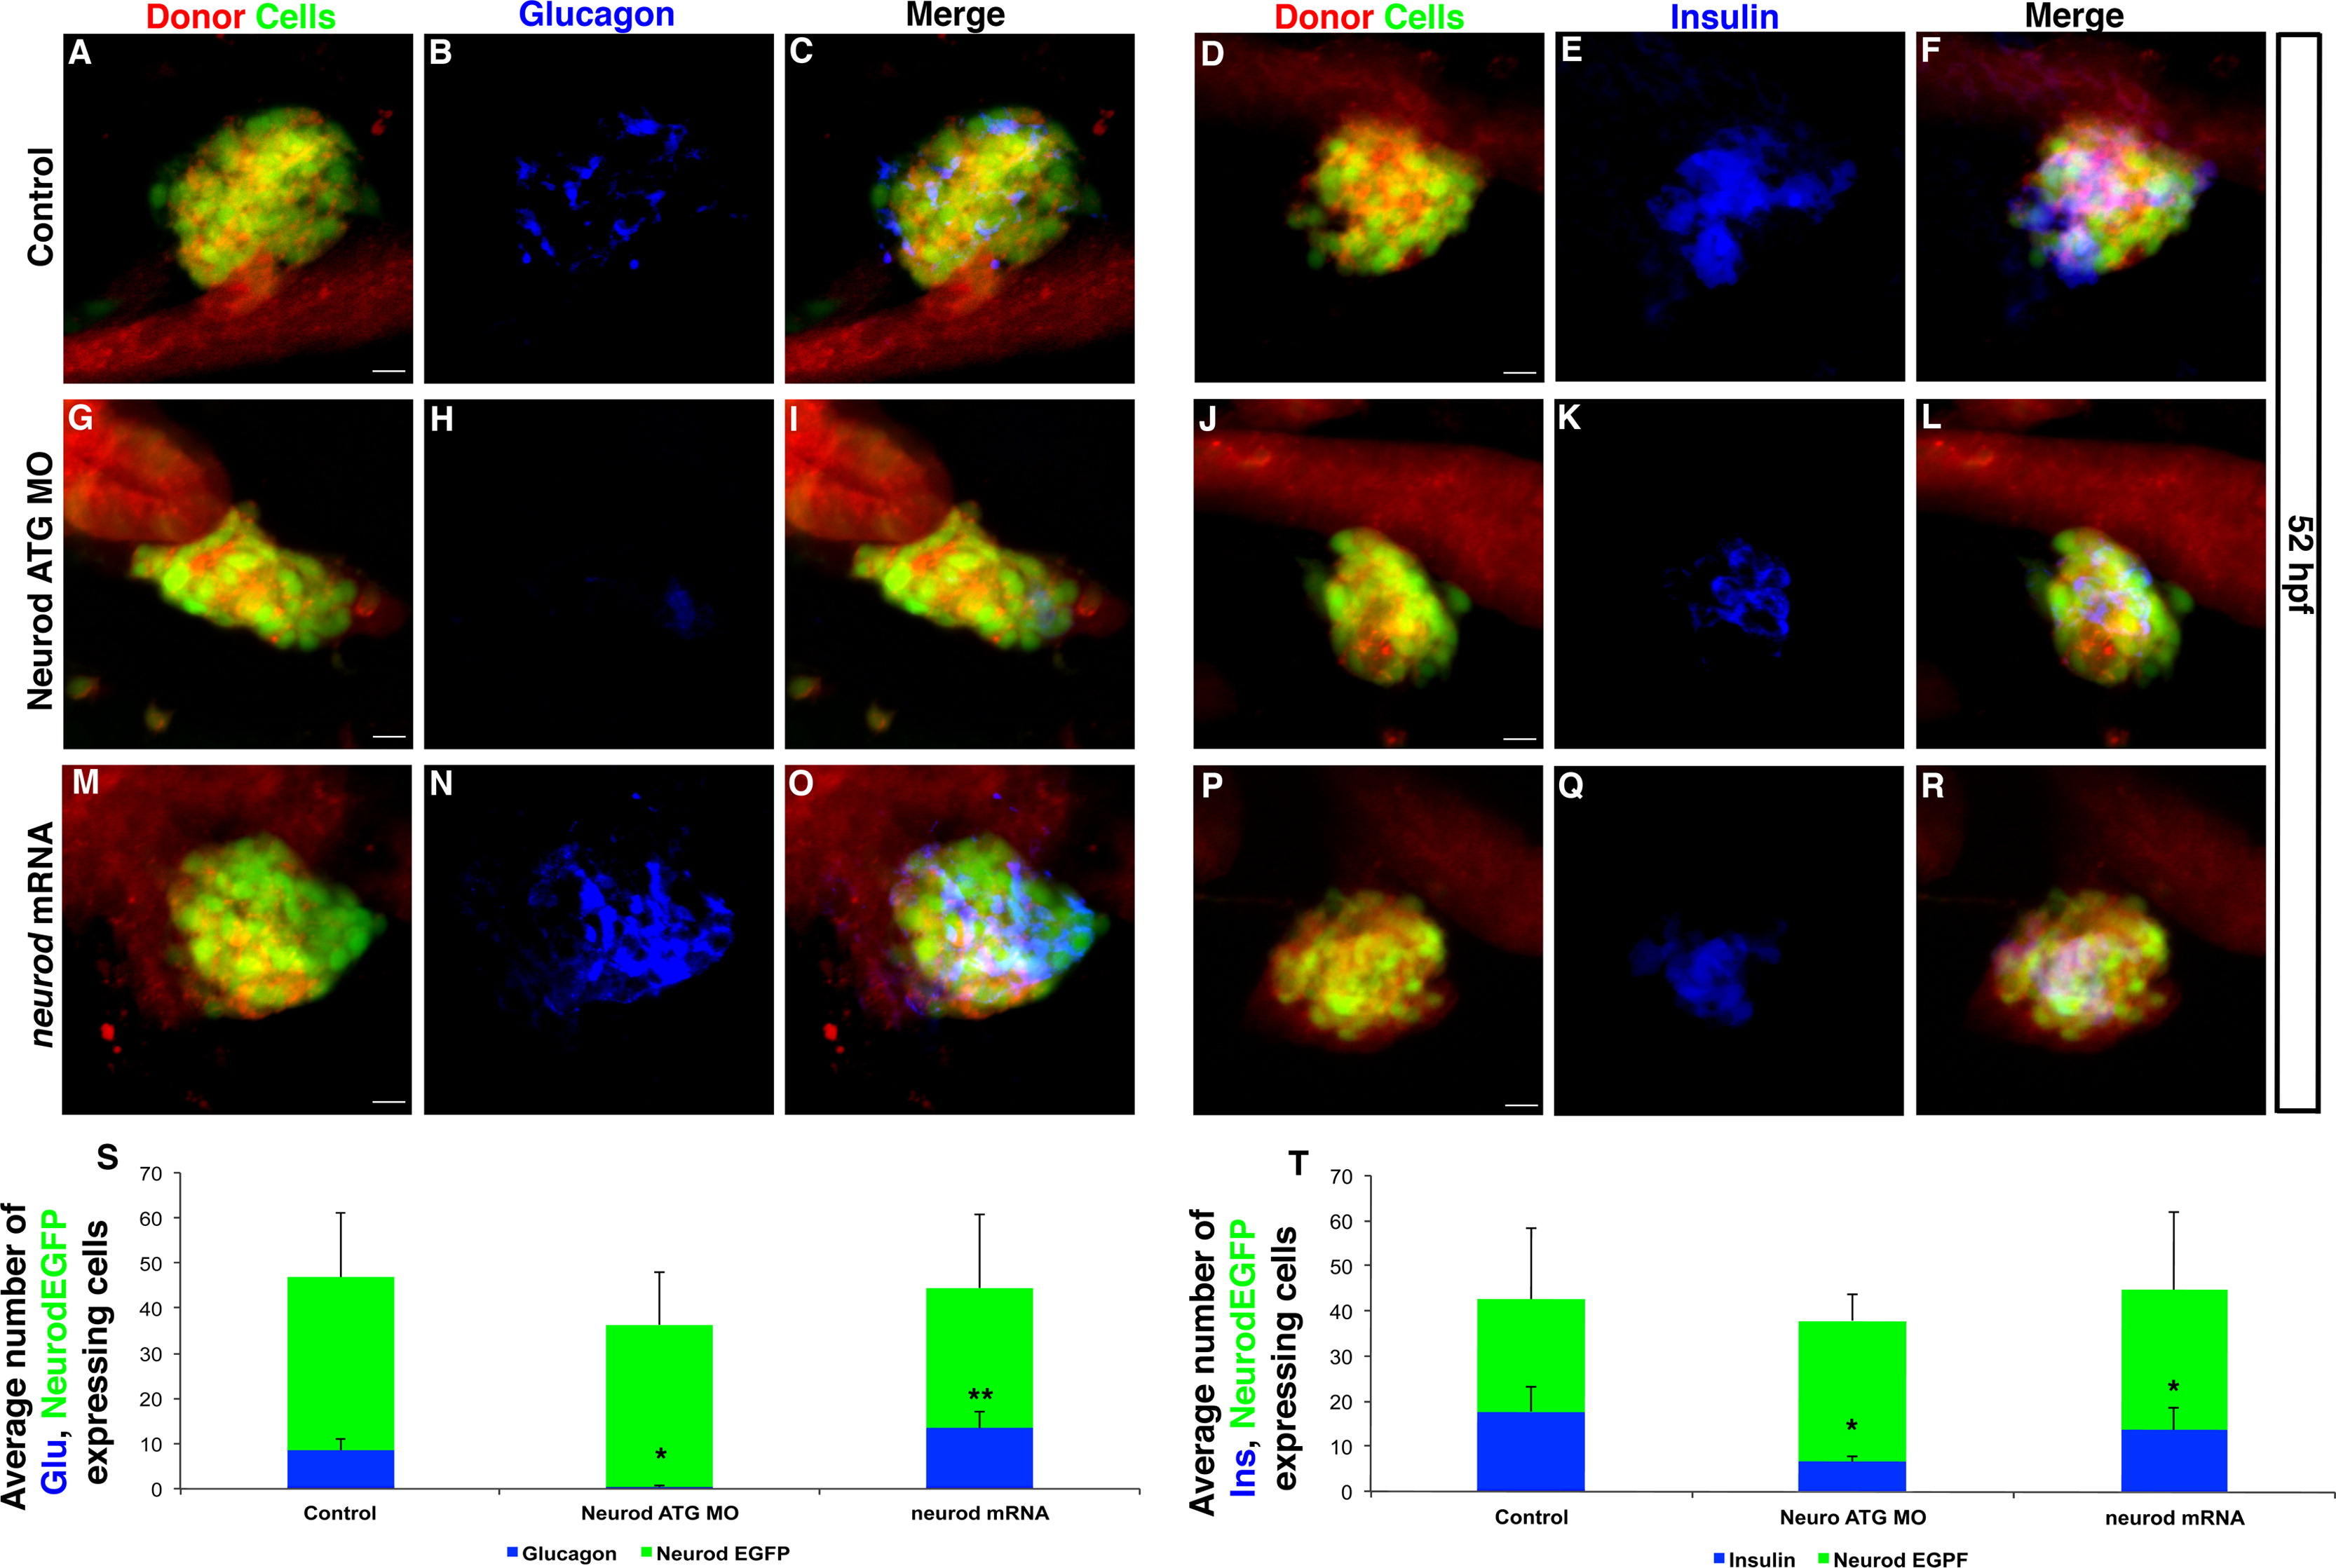
Fig. 5
Increased Neurod levels promote alpha cell differentiation; beta cells are less sensitive than alpha cells to Neurod knockdown. (A-R) Confocal images (merged z-stacks) of representative 52 hpf chimeric specimens in which the entire endoderm is derived from control (A-F), Neurod morphant (G-L) or neurod mRNA injected (M-R) donor cell transplants. Embryos are immunolabeled for EGFP (green; A, D, G, J, M, P) for glucagon (blue; B, H, N) and for insulin (blue; E, K, Q). EGFP and Rhodamine Dextran (red) labels donor-derived cells (A, D, G, J, M, P). Merged images with all three colors are also shown (C, F, I, L, O, R). (S) Mean (± s.d.) average number of cells expressing glucagon and EGFP-expressing endocrine cells, from a minimum of 4 chimeric embryos per group. *, P<0.002, **, P<0.01; t-test, two-tailed distribution. (T) Mean (± s.d.) average number of cells expressing insulin and EGFP-expressing endocrine cells, from a minimum of 5 chimeric embryos per group. *, P<0.004; t-test, two-tailed distribution. Scale bar=10 µm.
Reprinted from Developmental Biology, 402(1), Dalgin, G., Prince, V.E., Differential levels of Neurod establish zebrafish endocrine pancreas cell fates, 81-97, Copyright (2015) with permission from Elsevier. Full text @ Dev. Biol.