
|
Fig. 4
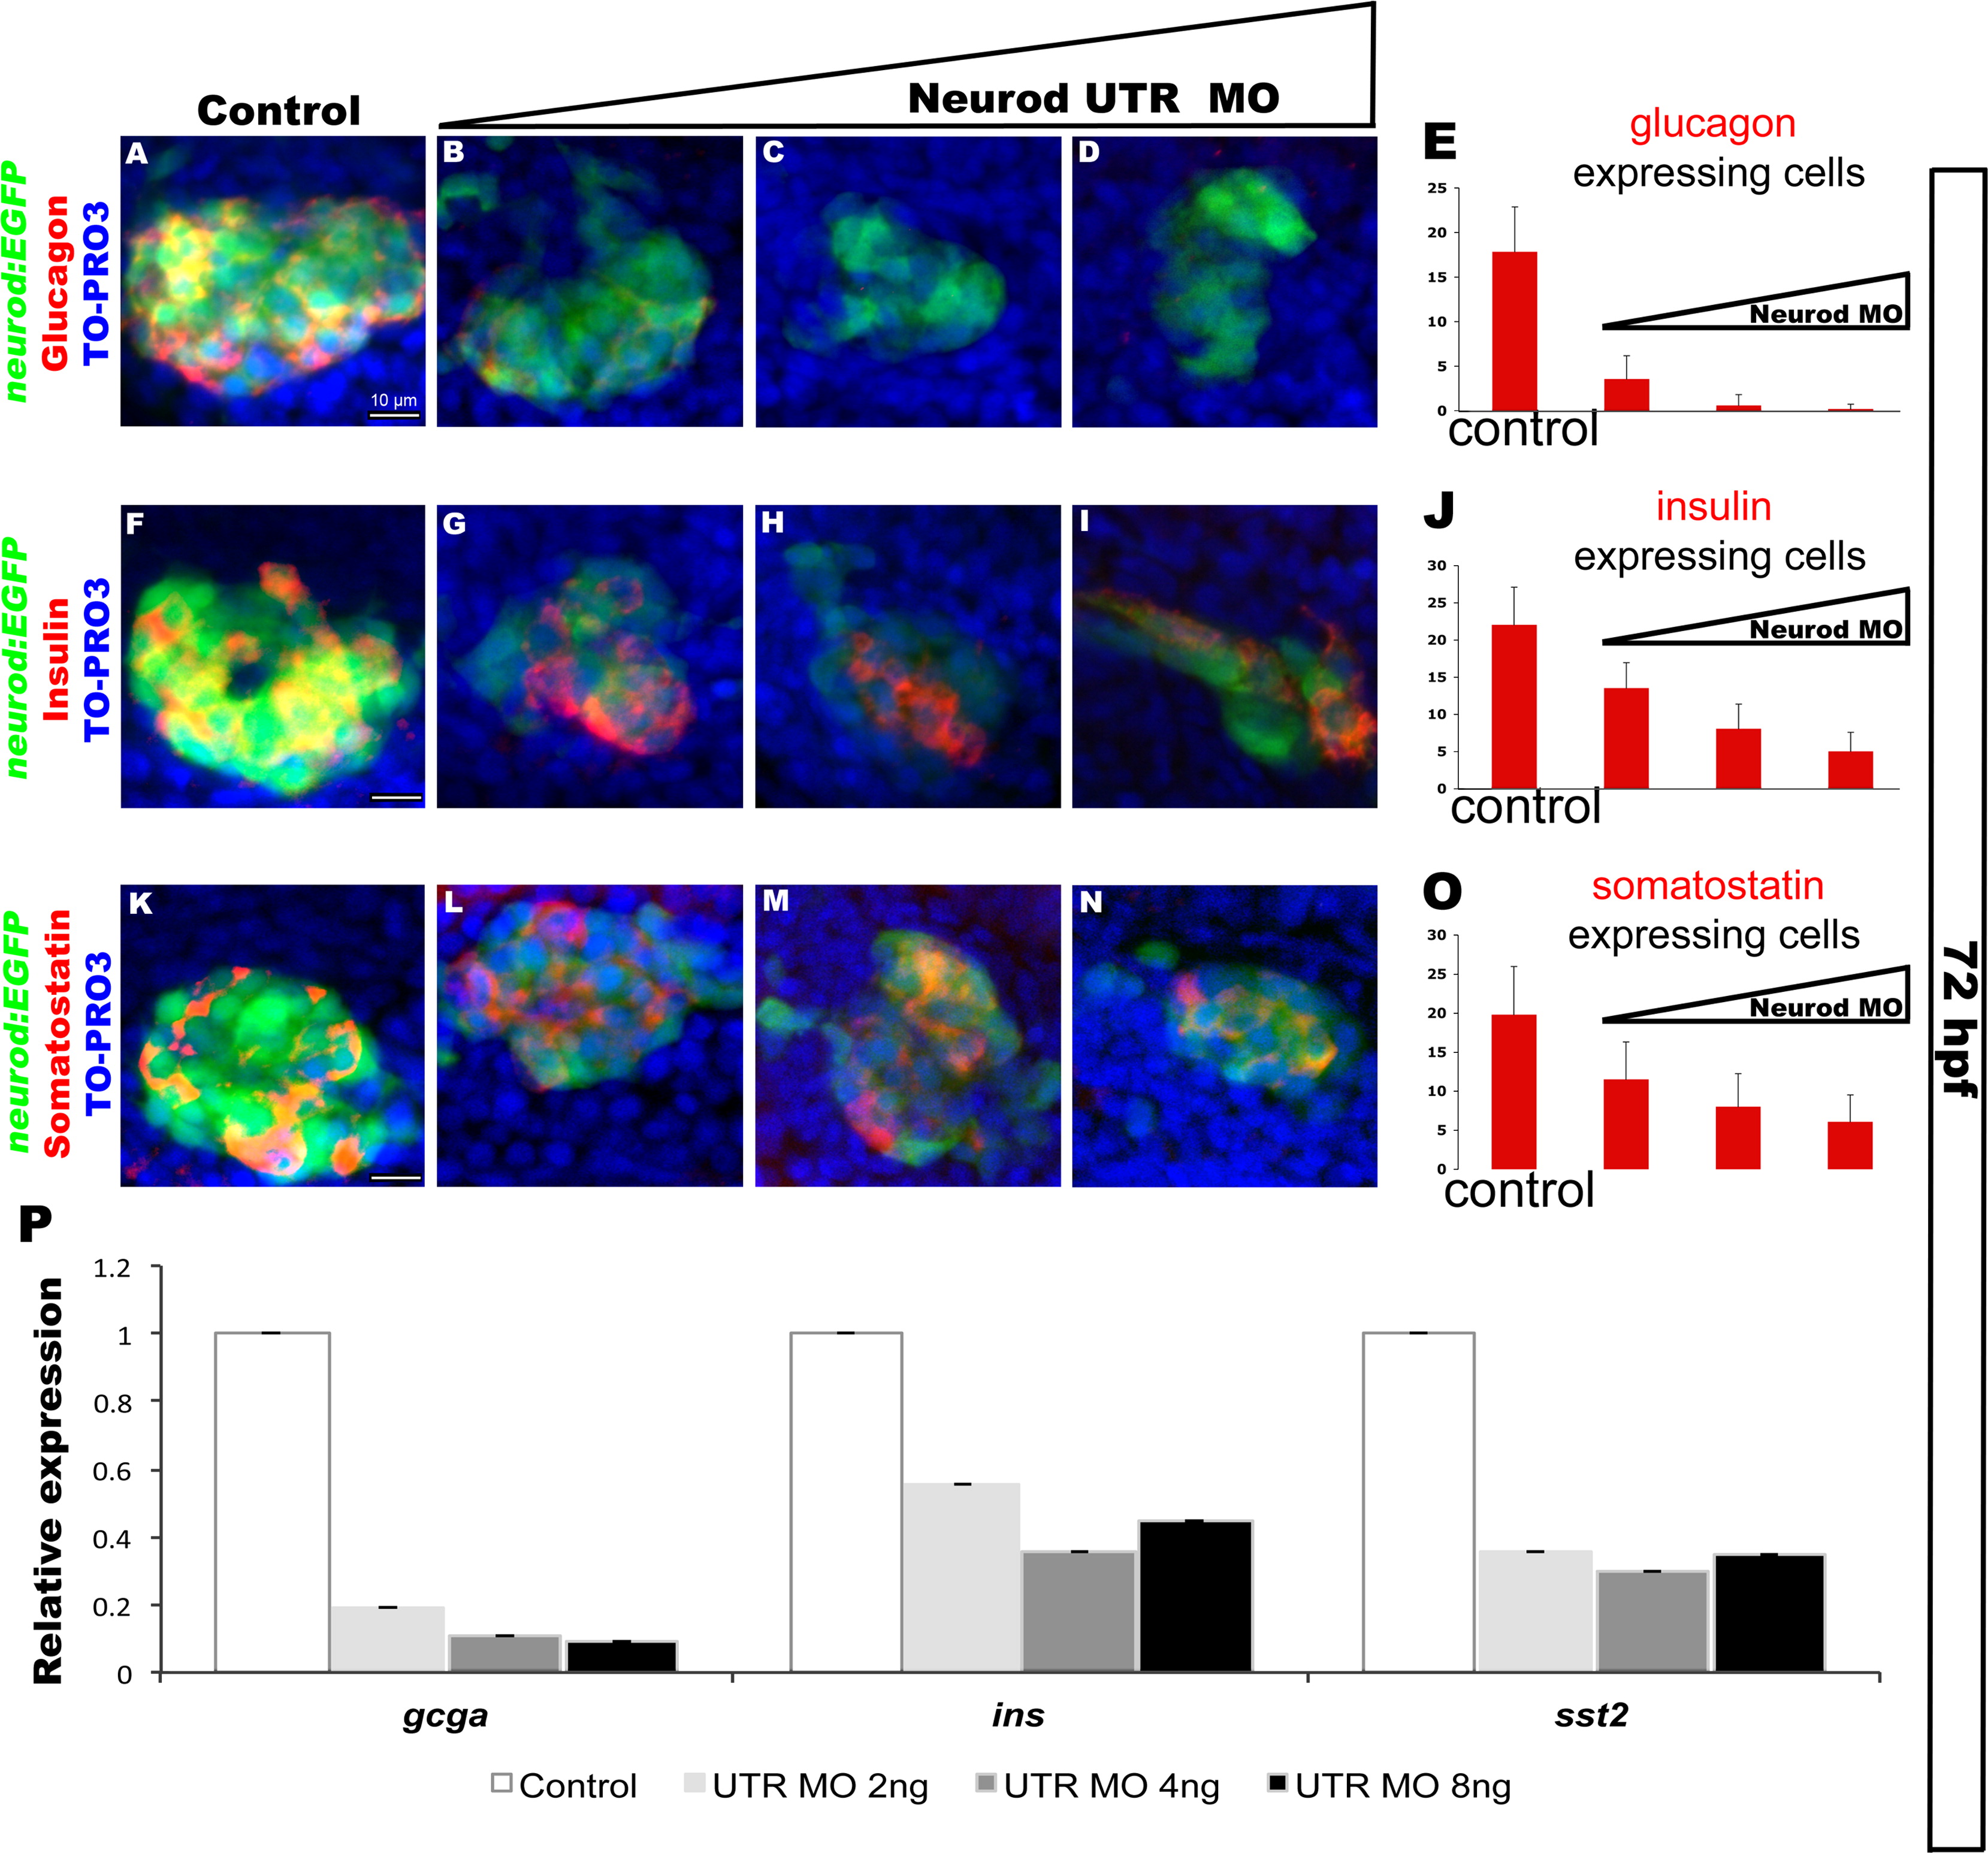
Neurod is also required for differentiation of endocrine cells from the ventral bud. Confocal images (merged z-stacks) of representative 72 hpf Tg(neurod:EGFP) embryos. Whole mount immunolabeling for glucagon (red, A–D), insulin (red, F–I), somatostatin (red, K–N), GFP (green), with nuclear staining TO-PRO-3 (blue). Control (A, F, K), Neurod UTR MO 2 ng (B, G, L), 4 ng (C, H, M) or 8 ng (D, I, N) injected specimens. Mean (±s.d.) number of cells expressing glucagon (E), insulin (J) and somatostatin (O) from 5 independent experiments and from a minimum of 55 embryos per group. (P) Relative levels of gcga, insa and sst2 by real-time qPCR. Results are from 2 independent experiments and from 3 technical replicas and confirmed by two independent primer sets per gene of interest. All values were normalized to beta-actin levels. Primer sequences are listed in Table S1. White scale bar=10 µm.
Reprinted from Developmental Biology, 402(1), Dalgin, G., Prince, V.E., Differential levels of Neurod establish zebrafish endocrine pancreas cell fates, 81-97, Copyright (2015) with permission from Elsevier. Full text @ Dev. Biol.