
|
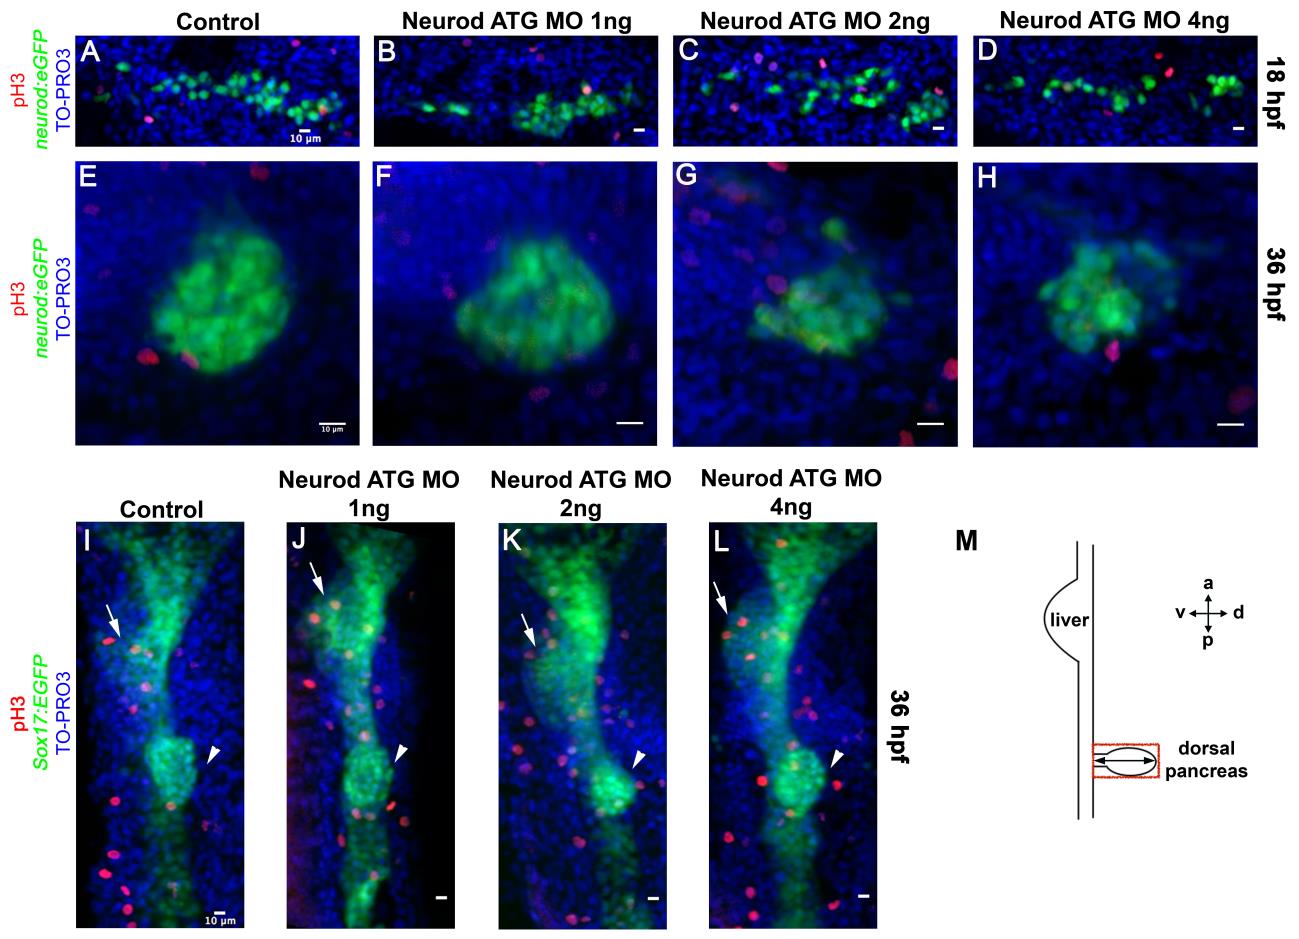
Fig. S5
Neurod-deficient endocrine cells remain undifferentiated and have normal proliferation rate. Representation of confocal images (merged z-stacks) in Fig. 3, together with nuclear marker TO-PRO3. 18 hpf (A-D) and 36 hpf (E-H) Tg(neurod:EGFP) and 36 hpf Tg(sox17:EGFP) (I-L) embryos. Control (A, E, I), Neurod ATG MO 1 ng (B, F, J), 2 ng (C, G, K) or 4 ng (D, H, L) injected specimens. Whole mount immunolabeling for pH3 (red, A-L). (M) Schematic representation of Tg(sox17:EGFP) embryo. The red box indicates the dorsal pancreatic bud; pH3 and GFP-positive cells were counted from the tip of the dorsal bud going ventral towards the gut tube to determine proliferation rate in the specimens. Arrows indicate liver and arrowheads indicate dorsal pancreas region (I-L). Scale bar=10 µm.
Reprinted from Developmental Biology, 402(1), Dalgin, G., Prince, V.E., Differential levels of Neurod establish zebrafish endocrine pancreas cell fates, 81-97, Copyright (2015) with permission from Elsevier. Full text @ Dev. Biol.