
Image
|
Figure Caption
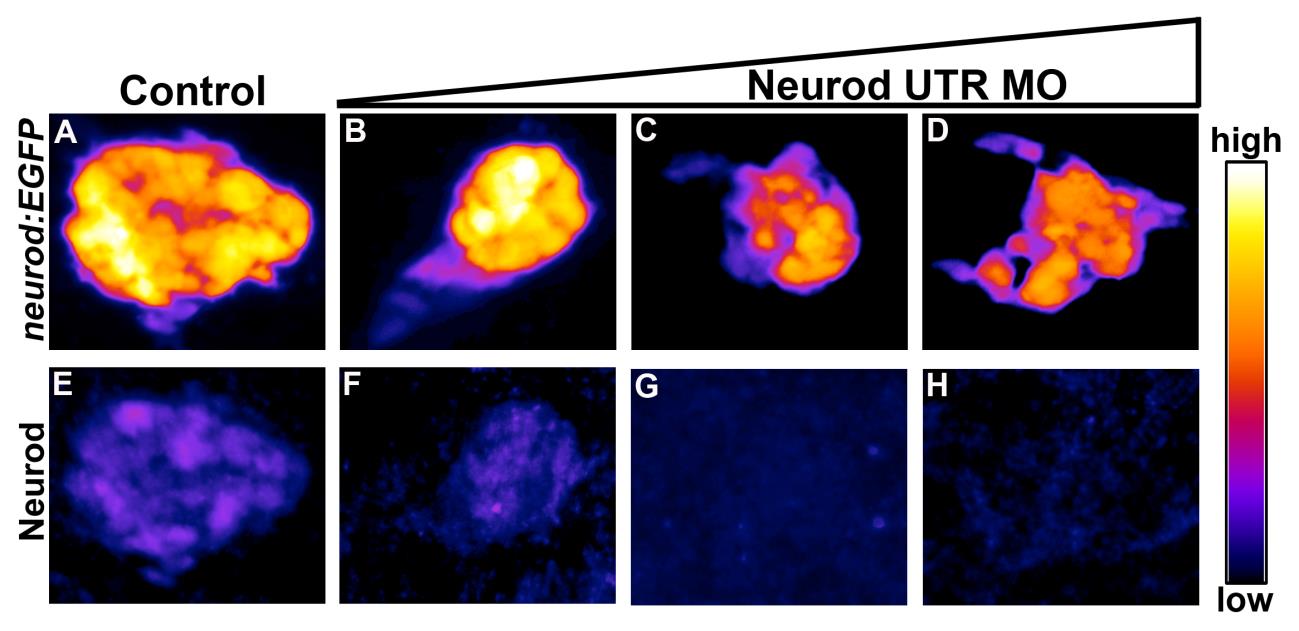
Fig. S2
False-colored images of control and Neurod morphant specimens. Confocal images (merged z-stacks) of the dorsal pancreatic bud in Tg(neurod:EGFP) from Fig. 1 were false colored using ImageJ. (A, E) Control embryos. Neurod UTR MO injected specimens, (B, F) 2 ng/embryo, (C, G) 4 ng/embryo, (D, H) 8 ng/embryo. Fire scale heat map; high intensity (white) low intensity (black). White scale bar =10 µm.
Acknowledgments
This image is the copyrighted work of the attributed author or publisher, and
ZFIN has permission only to display this image to its users.
Additional permissions should be obtained from the applicable author or publisher of the image.
Reprinted from Developmental Biology, 402(1), Dalgin, G., Prince, V.E., Differential levels of Neurod establish zebrafish endocrine pancreas cell fates, 81-97, Copyright (2015) with permission from Elsevier. Full text @ Dev. Biol.