
Image
|
Figure Caption
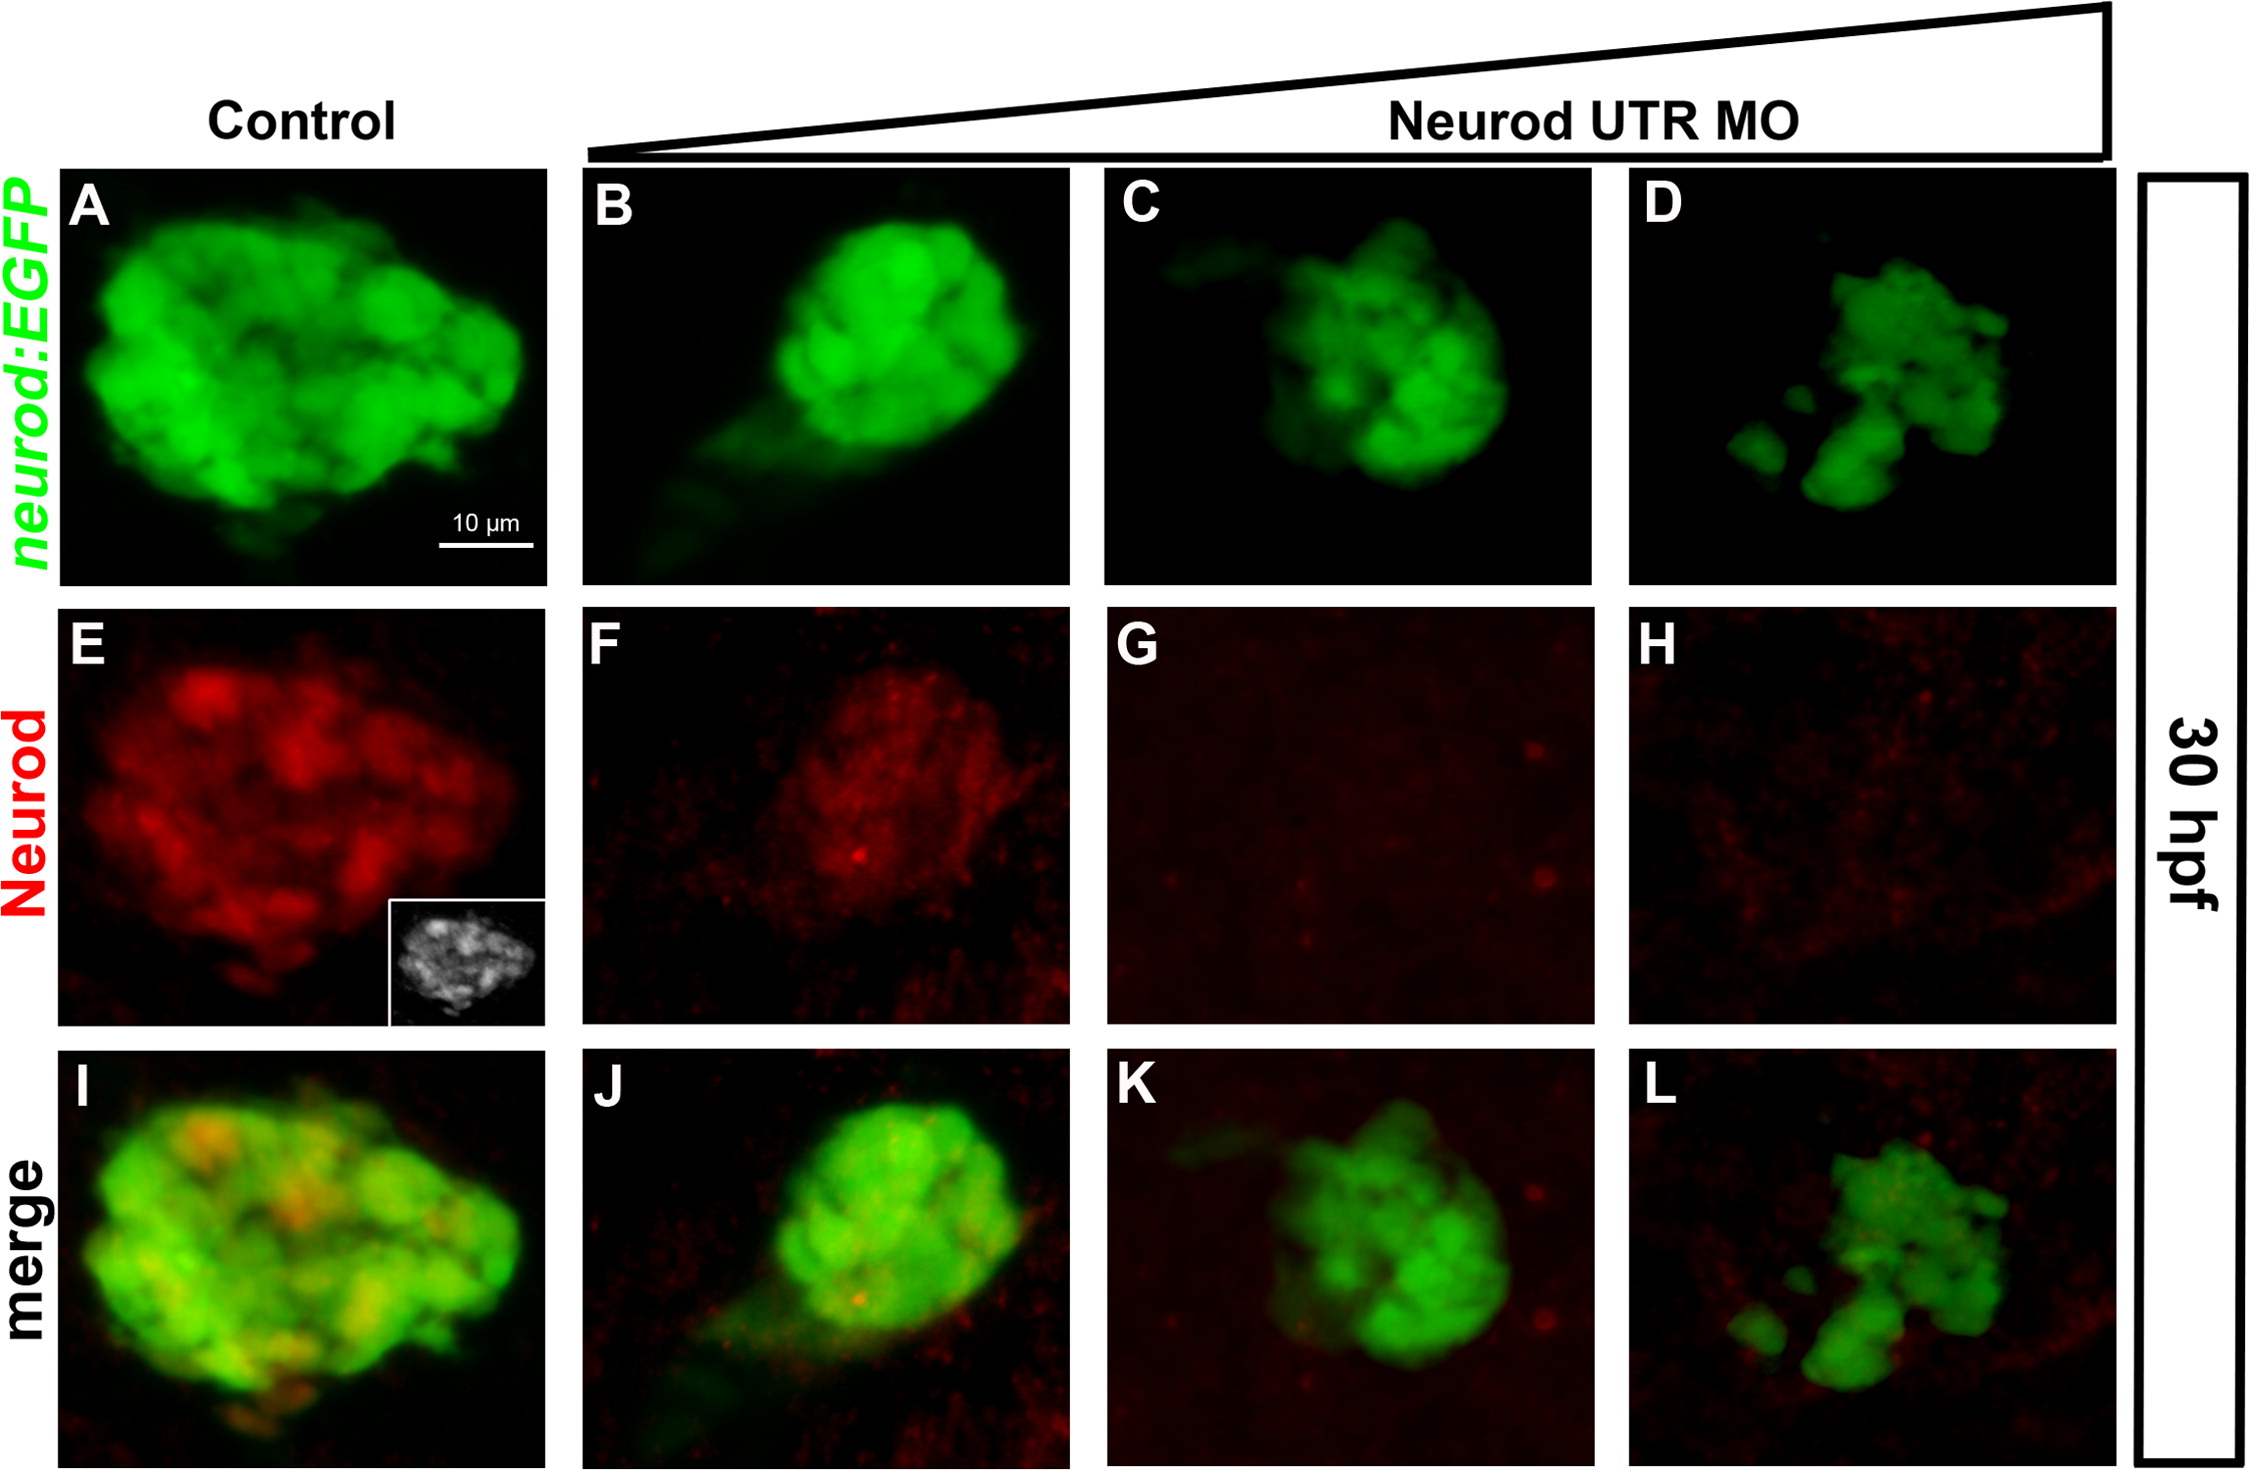
Fig. 1
Morpholino knockdown causes progressive depletion of Neurod. Whole mount immunolabeling for GFP (green) and Neurod (red) protein. Confocal images (merged z-stacks) of the dorsal pancreatic bud in Tg(neurod:EGFP) embryos at 30 hpf. (A, E, I) Control embryos; (E; inset) gray scale. Neurod UTR MO injected specimens (B, F, J) 2 ng/embryo, (C, G, K) 4 ng/embryo (D, H, L) 8 ng/embryo. Scale bar=10 µm.
Acknowledgments
This image is the copyrighted work of the attributed author or publisher, and
ZFIN has permission only to display this image to its users.
Additional permissions should be obtained from the applicable author or publisher of the image.
Reprinted from Developmental Biology, 402(1), Dalgin, G., Prince, V.E., Differential levels of Neurod establish zebrafish endocrine pancreas cell fates, 81-97, Copyright (2015) with permission from Elsevier. Full text @ Dev. Biol.