
|
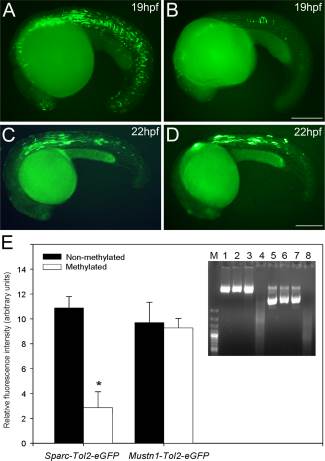
Fig. 5
Effects of methylation on zebrafish sparc promoter activity in vitro. Zebrafish embryos were microinjected with 7,25kb-sparc-Tol2-eGFP or 0,7kb-Musnt1-Tol2-eGFP methylated (B,D) and unmethylated (A,C) promoter vectors. Microinjected methylated and unmethylated groups were as follows: (1) zebrafish 7,5Kb Sparc promoter cloned into pTolEGFPDest reporter plasmid (7,25kb-sparc-Tol2-eGFP) (A,B); (2) zebrafish 0,75Kb Mustnt1 promoter cloned into pTolEGFPDest reporter plasmid (0,7kb-Mustn1b-Tol2-eGFP) (Ctrl, CpG-free Promoter) (C,D). E: Intensity of eGFP fluorescent measurements were performed with Image J and displayed as vertical bar chart. Student t tests were performed to determine statistical relevance. Values are shown as mean ± S.E.M. (n = 10). E Inset: Successful vector methylation verification by analysis of band patterns on electrophoresis gel after digestion of the purified plasmids with the McrBC enzyme. Lane M, 1 Kb marker; lanes 1 and 5, 1 µg 7,25kb-sparc-Tol2-eGFP or 0,7kb-mustn1b-Tol2-eGFP; lanes 2 and 6, 1 µg 7,25kb-sparc-Tol2-eGF or 0,7kb-mustn1b-Tol2-eGFP treated with McrBC; lanes 3 and 7, 1 µg SssI-methylated 7,25kb-sparc-Tol2-eGFP or 0,7kb-mustn1b-Tol2-eGFP; lanes 4 and 8, 1 µg SssI-methylated 7,25kb-sparc-Tol2-eGFP or 0,7kb-mustn1b-Tol2-eGFP treated with McrBC. As expected, only the methylated vector was digested. Scale bars = 250 µm.