
|
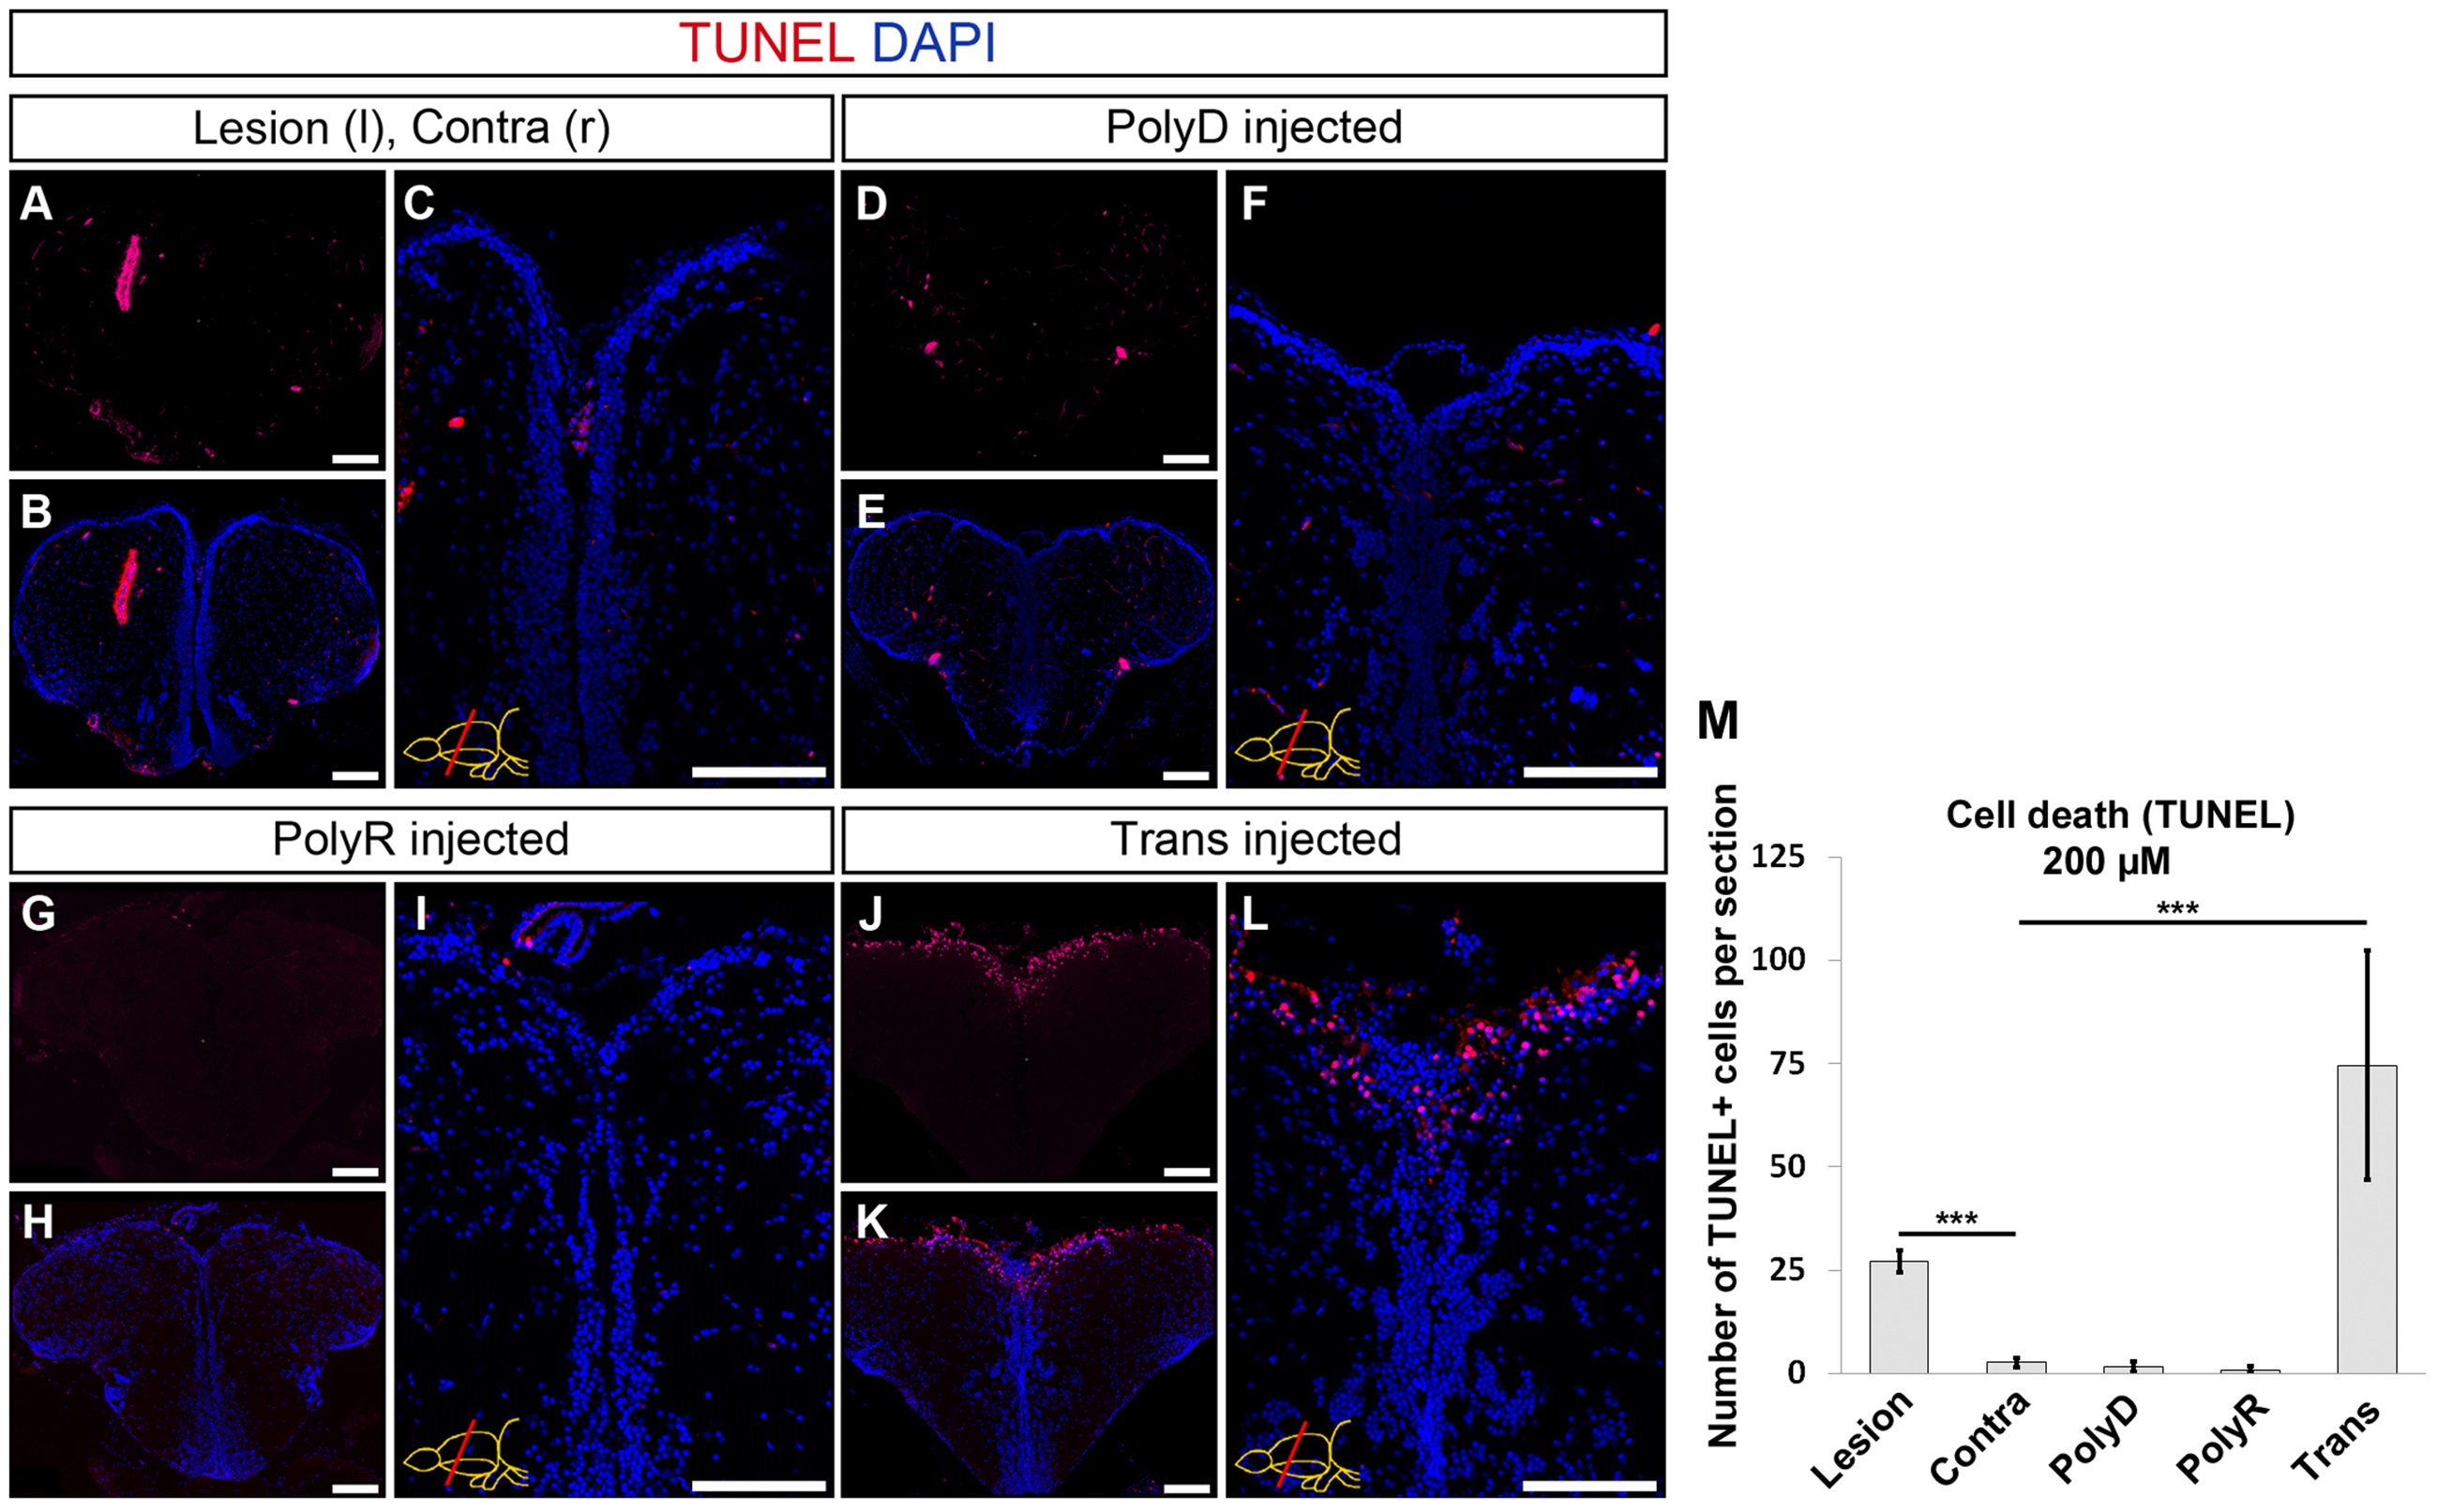
Fig. 3
Quantification of Cell Death upon Peptide Injection.
(A) TUNEL staining on rostral telencephalon of stab-lesioned brain, used as control. Lesioned hemisphere left and unstabbed contralateral hemisphere right. (B) DAPI counterstaining on A. (C) Magnified medial ventricular region of B. (D) TUNEL upon PolyD injection and DAPI counterstaining (E). (F) High magnification of medial ventricular region of E. (G) TUNEL staining on PolyR-injected brain and DAPI counterstaining (H). (J) TUNEL on Trans-injected brain. (K) DAPI counterstaining on J and high magnification of medial ventricular region (L). (M) Quantification of TUNEL-positive cells per telencephalic hemisphere. Scale bars = 100 µm, n = 3, data are mean + s.e.m.