
Image
|
Figure Caption
Fig. 2
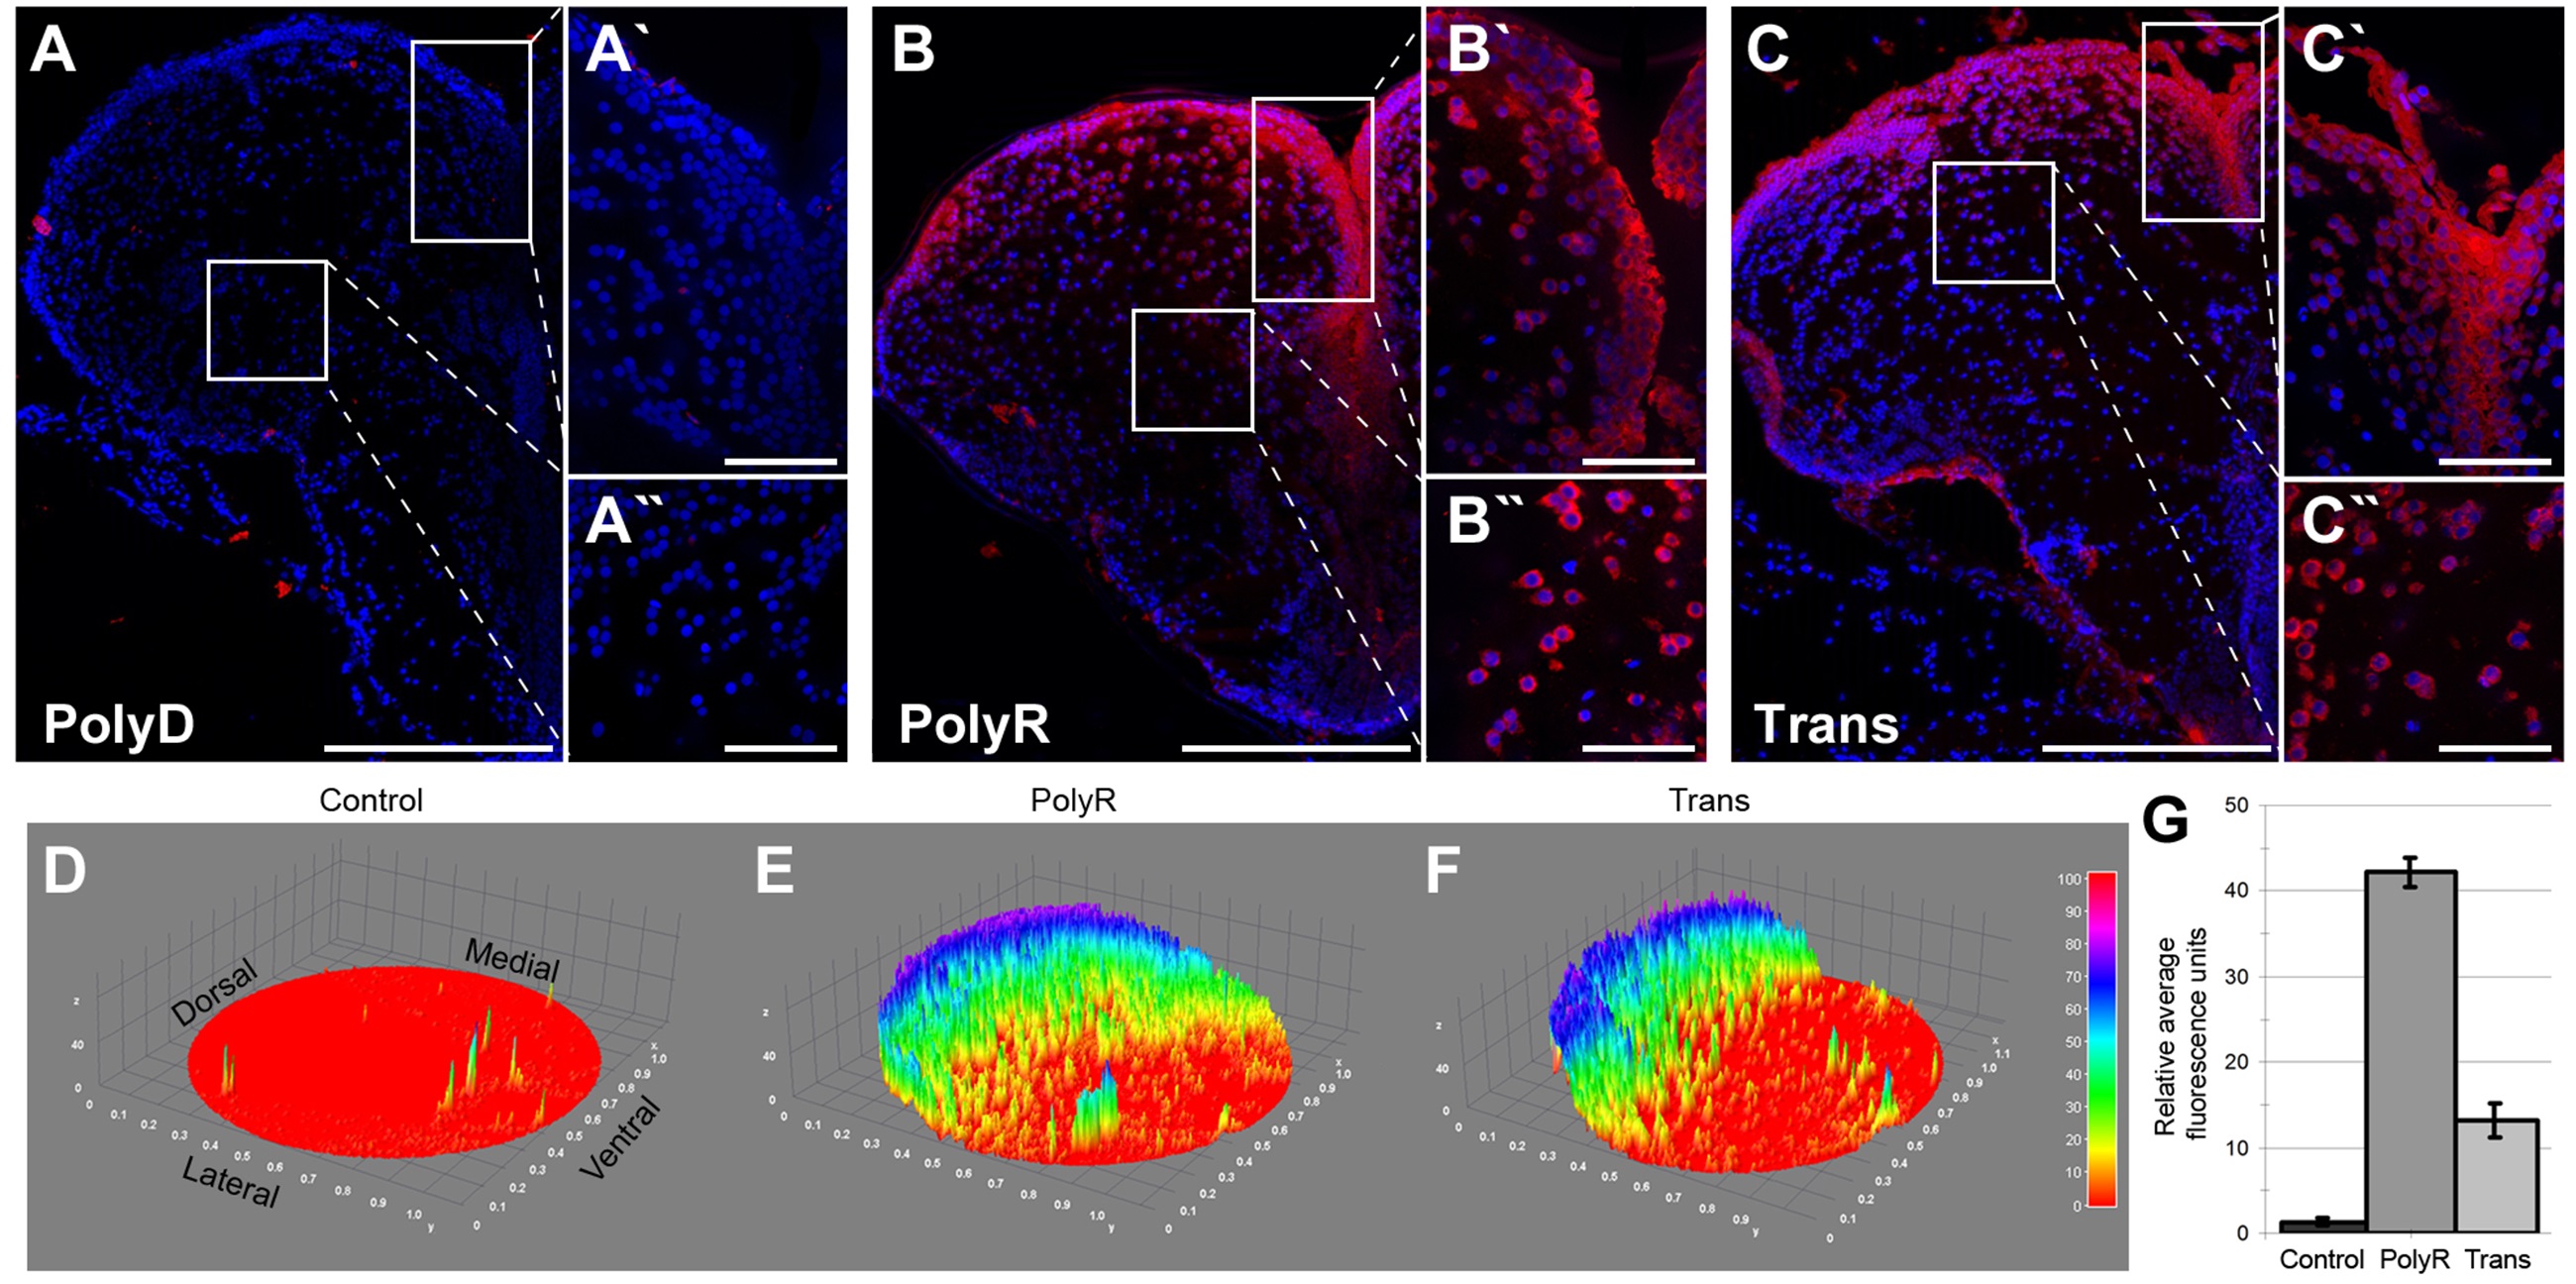
High Magnification Images of the Translocation of the Peptides PolyR and Trans with Surface Plots.
Fast-Red staining of cryosections upon 100 µM dose injection of peptides. (A) Control peptide PolyD does not translocate; neither into the ventricular area (A′) nor parenchyma (A′′). (B) PolyR shows strong translocation in the ventricular area (B′) yet also into the parenchyma (B′′). (C) Brain section showing Trans localization in ventricular area (B′) and parenchyma (C′′). Scale bars: 200 µm in A, B, C overviews; 50 µm in A, B, C insets.
Acknowledgments
This image is the copyrighted work of the attributed author or publisher, and
ZFIN has permission only to display this image to its users.
Additional permissions should be obtained from the applicable author or publisher of the image.
Full text @ PLoS One