
|
Fig. 3
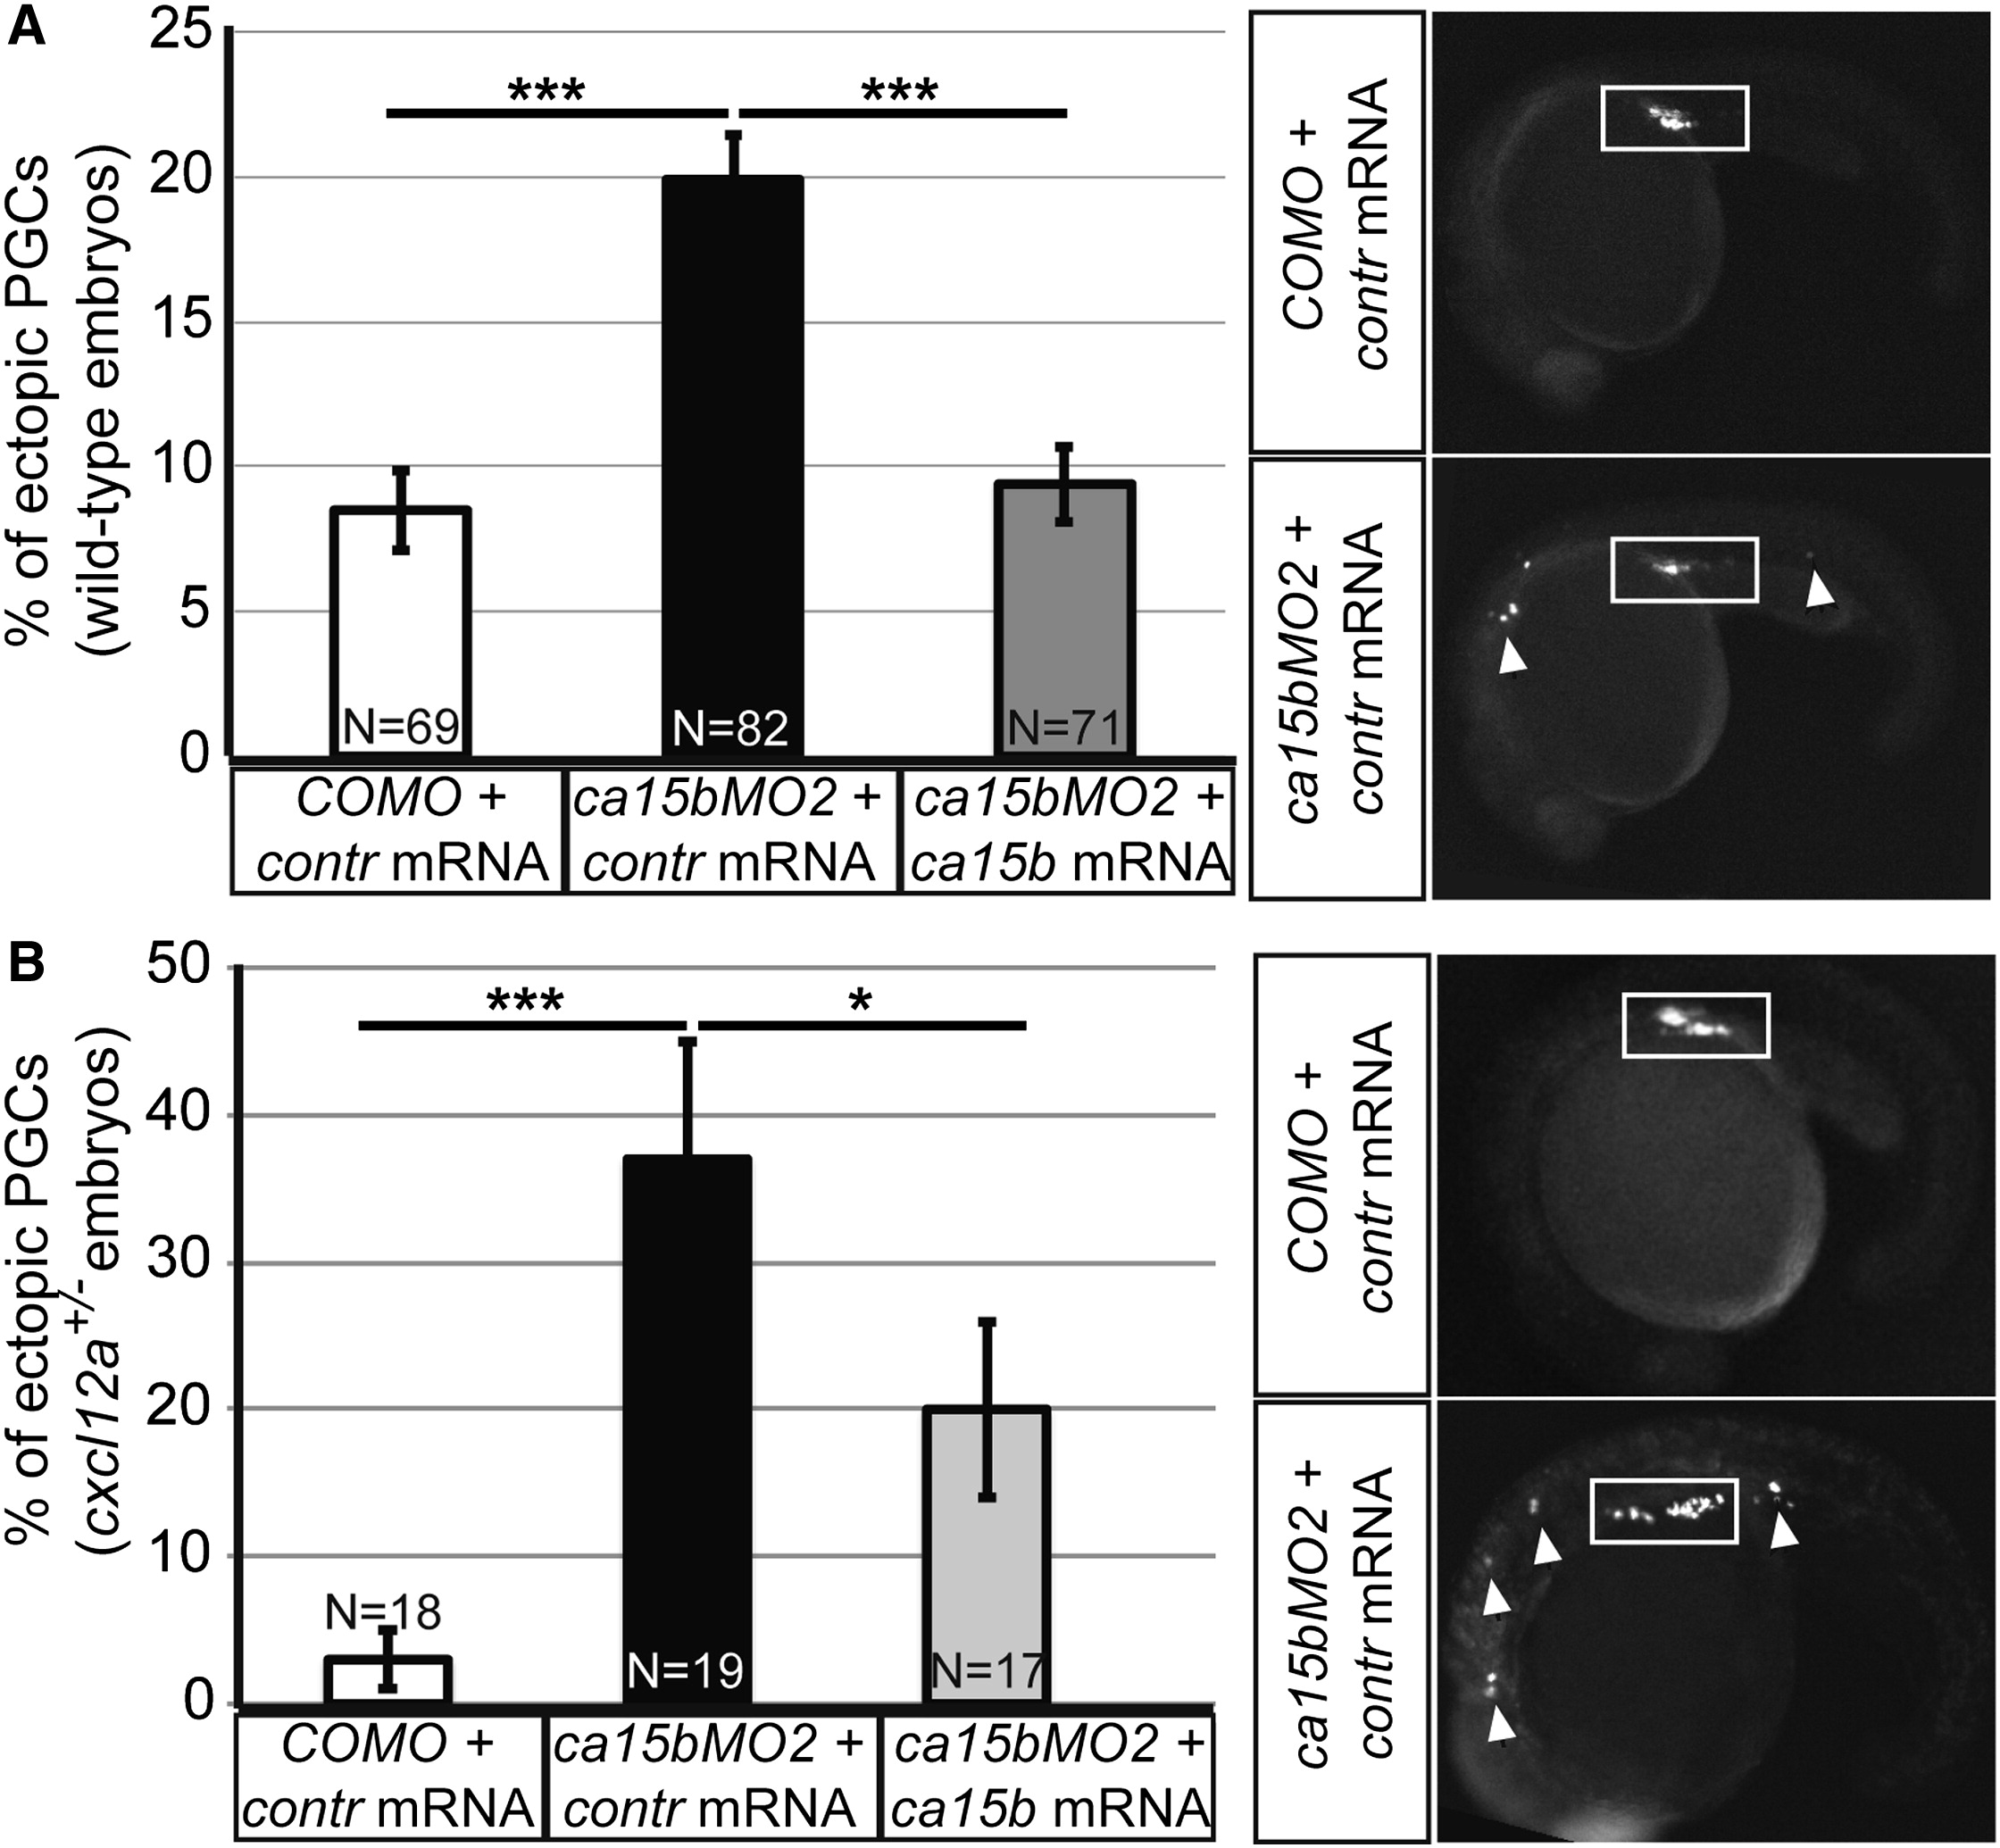
ca15b Knockdown Impairs PGC Migration
(A) Graph shows the percentage of ectopic PGCs from total PGC number in wild-type embryos at 24 hpf.
(B) Graph presents the average percentage of ectopic PGCs in 24 hpf embryos heterozygous for a mutation in cxcl12 (medusa mutation). Right panels show representative images of the PGC positioning in control and ca15b morphant embryos in wild-type (A) and in medusa+/- embryos (B).
N is number of embryos analyzed. White boxes depict the normal position of PGCs in 24 hpf embryos, arrowheads point at PGCs located in ectopic positions. p < 0.05, p < 0.001 as determined by the Student’s t test. Error bars depict SEM.