
|
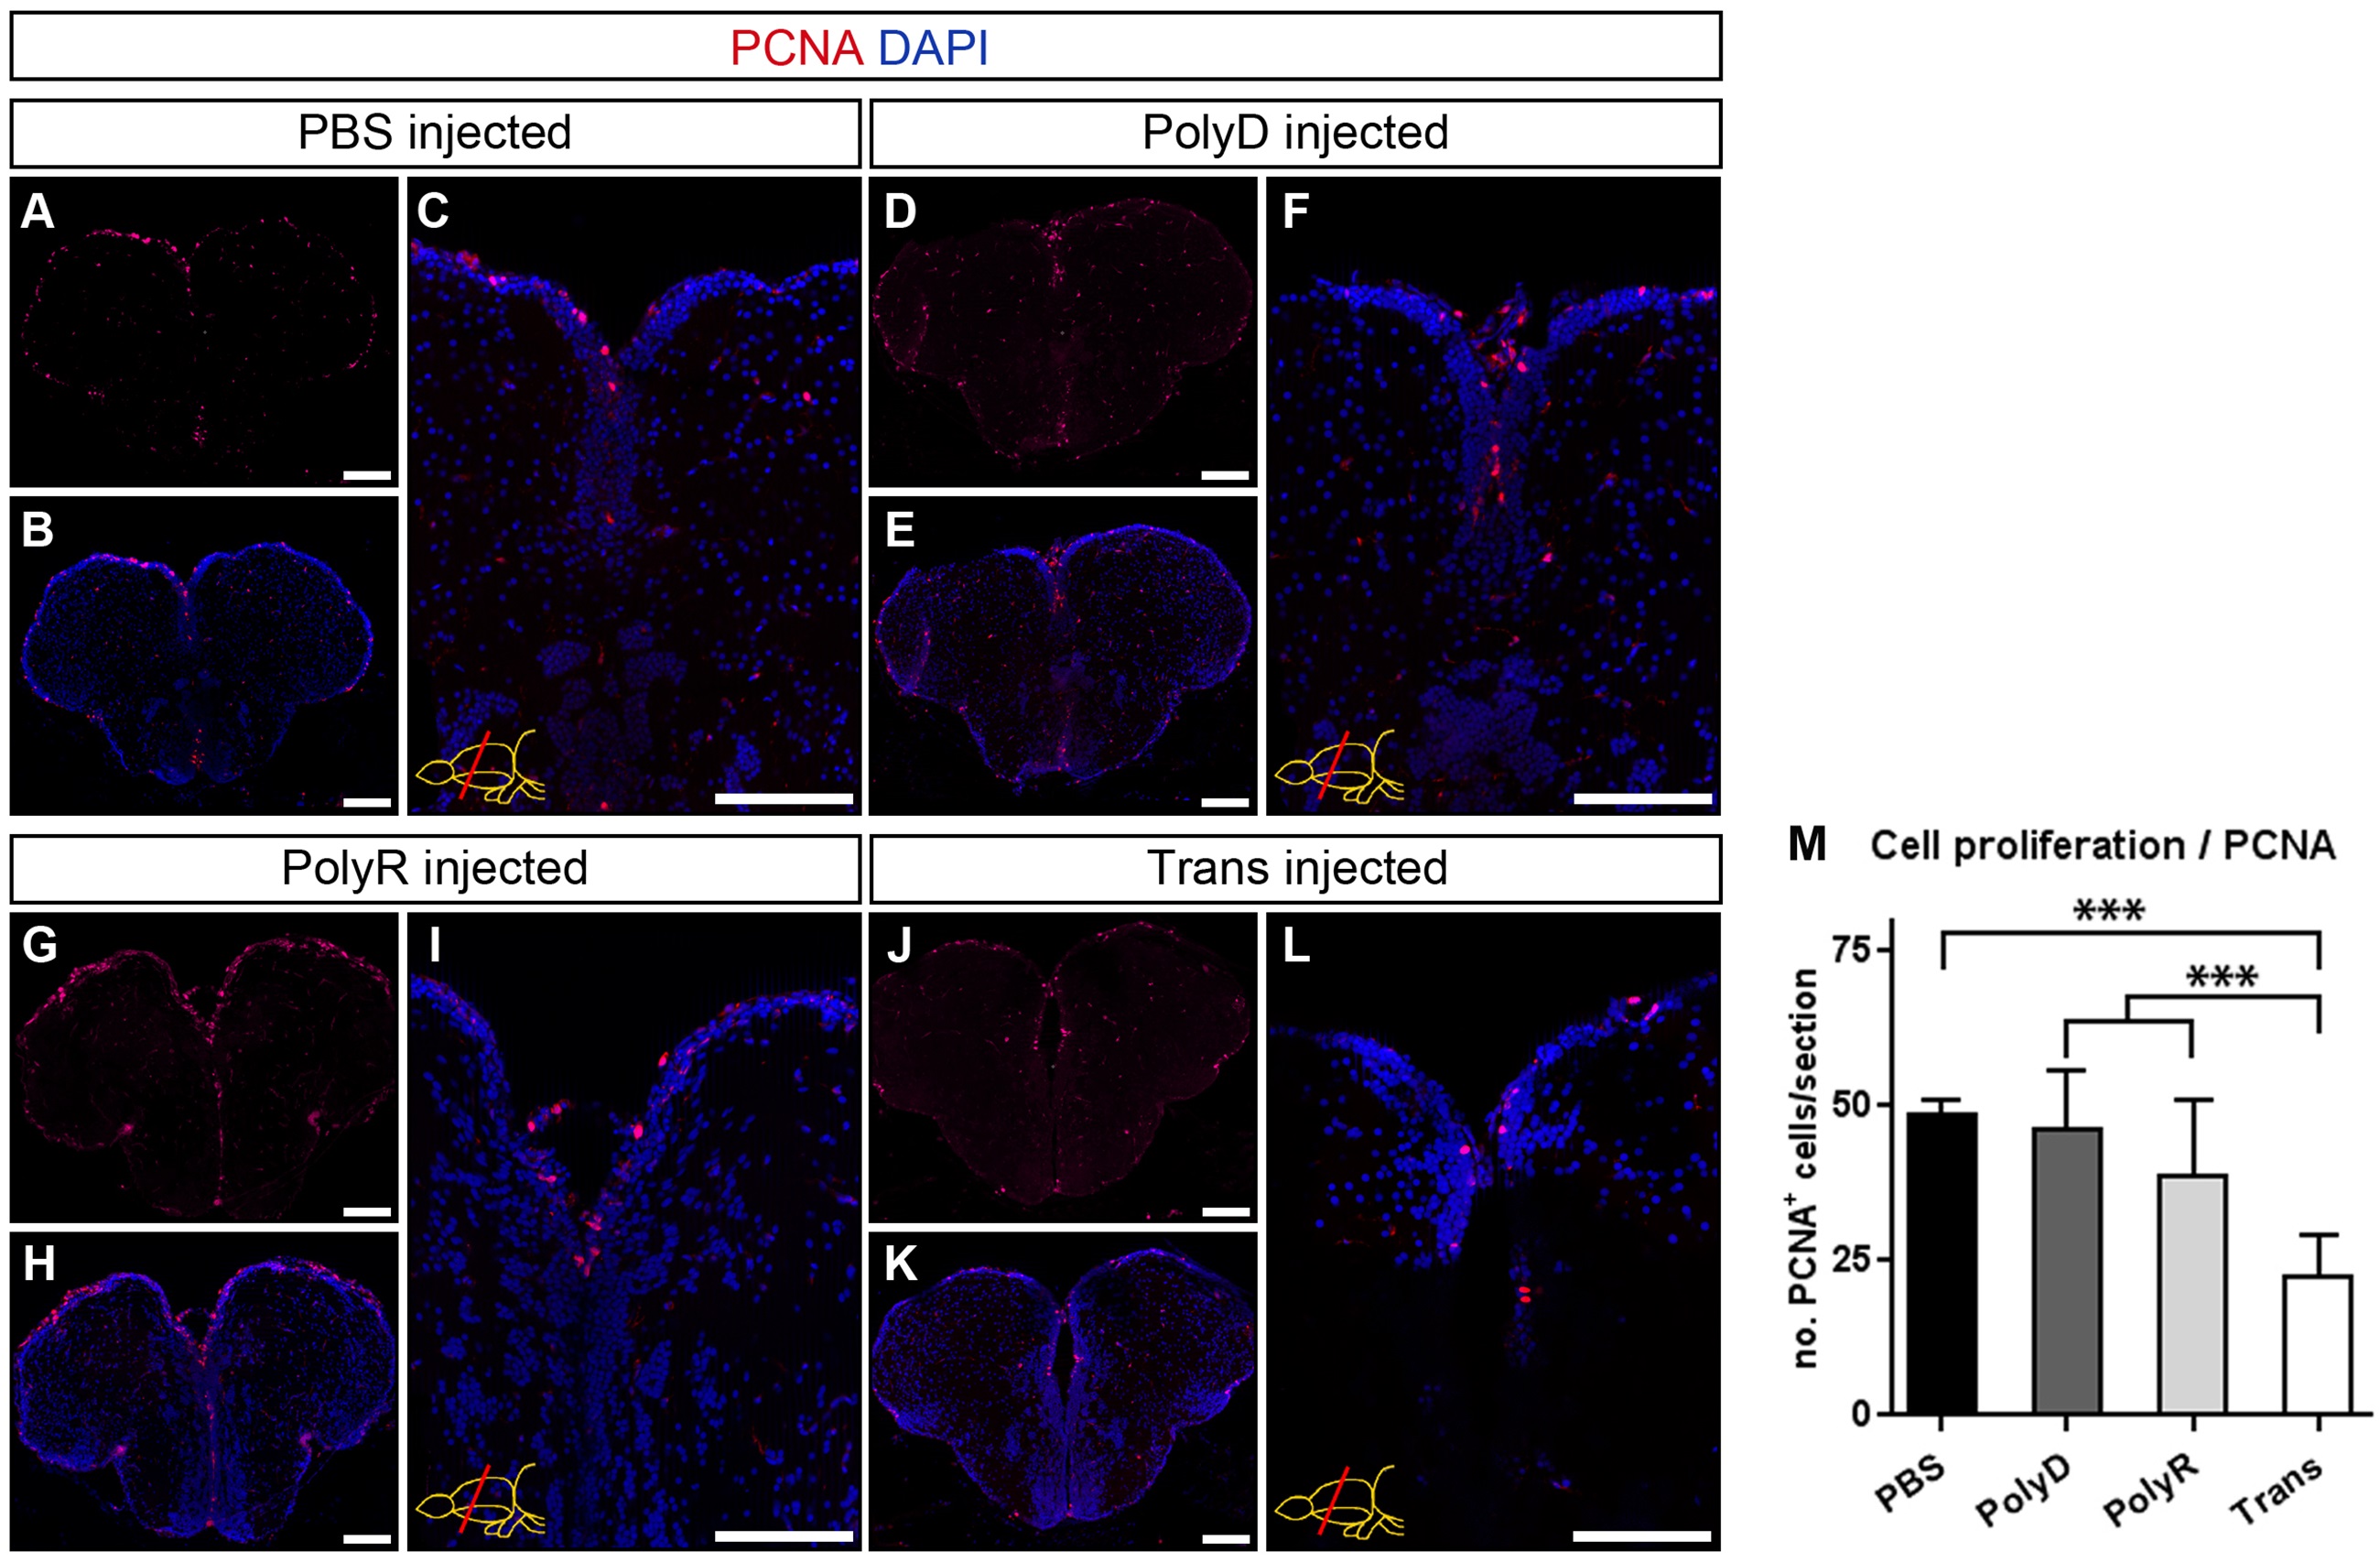
Fig. 7
Cell Proliferation after Peptide Injection.
(A) PCNA immunostaining on PBS-injected brains. (B) DAPI counterstaining on A. (C) Magnified medial ventricular region of B. (D) PCNA immunostaining on PolyD (control)-injected brains. (E) DAPI counterstaining on D. (F) Magnified medial ventricular region of E. (G) PCNA immunostaining on PolyR-injected brains. (H) DAPI counterstaining on G. (I) Magnified medial ventricular region of H. (J) PCNA immunostaining on Trans-injected brains. (K) DAPI counterstaining on J. (L) Magnified medial ventricular region of K. (M) Quantification of PCNA+ cells per telencephalic hemisphere section. Scale bars = 100 µm, n = 3 for every dataset, data are mean + s.e.m.