
|
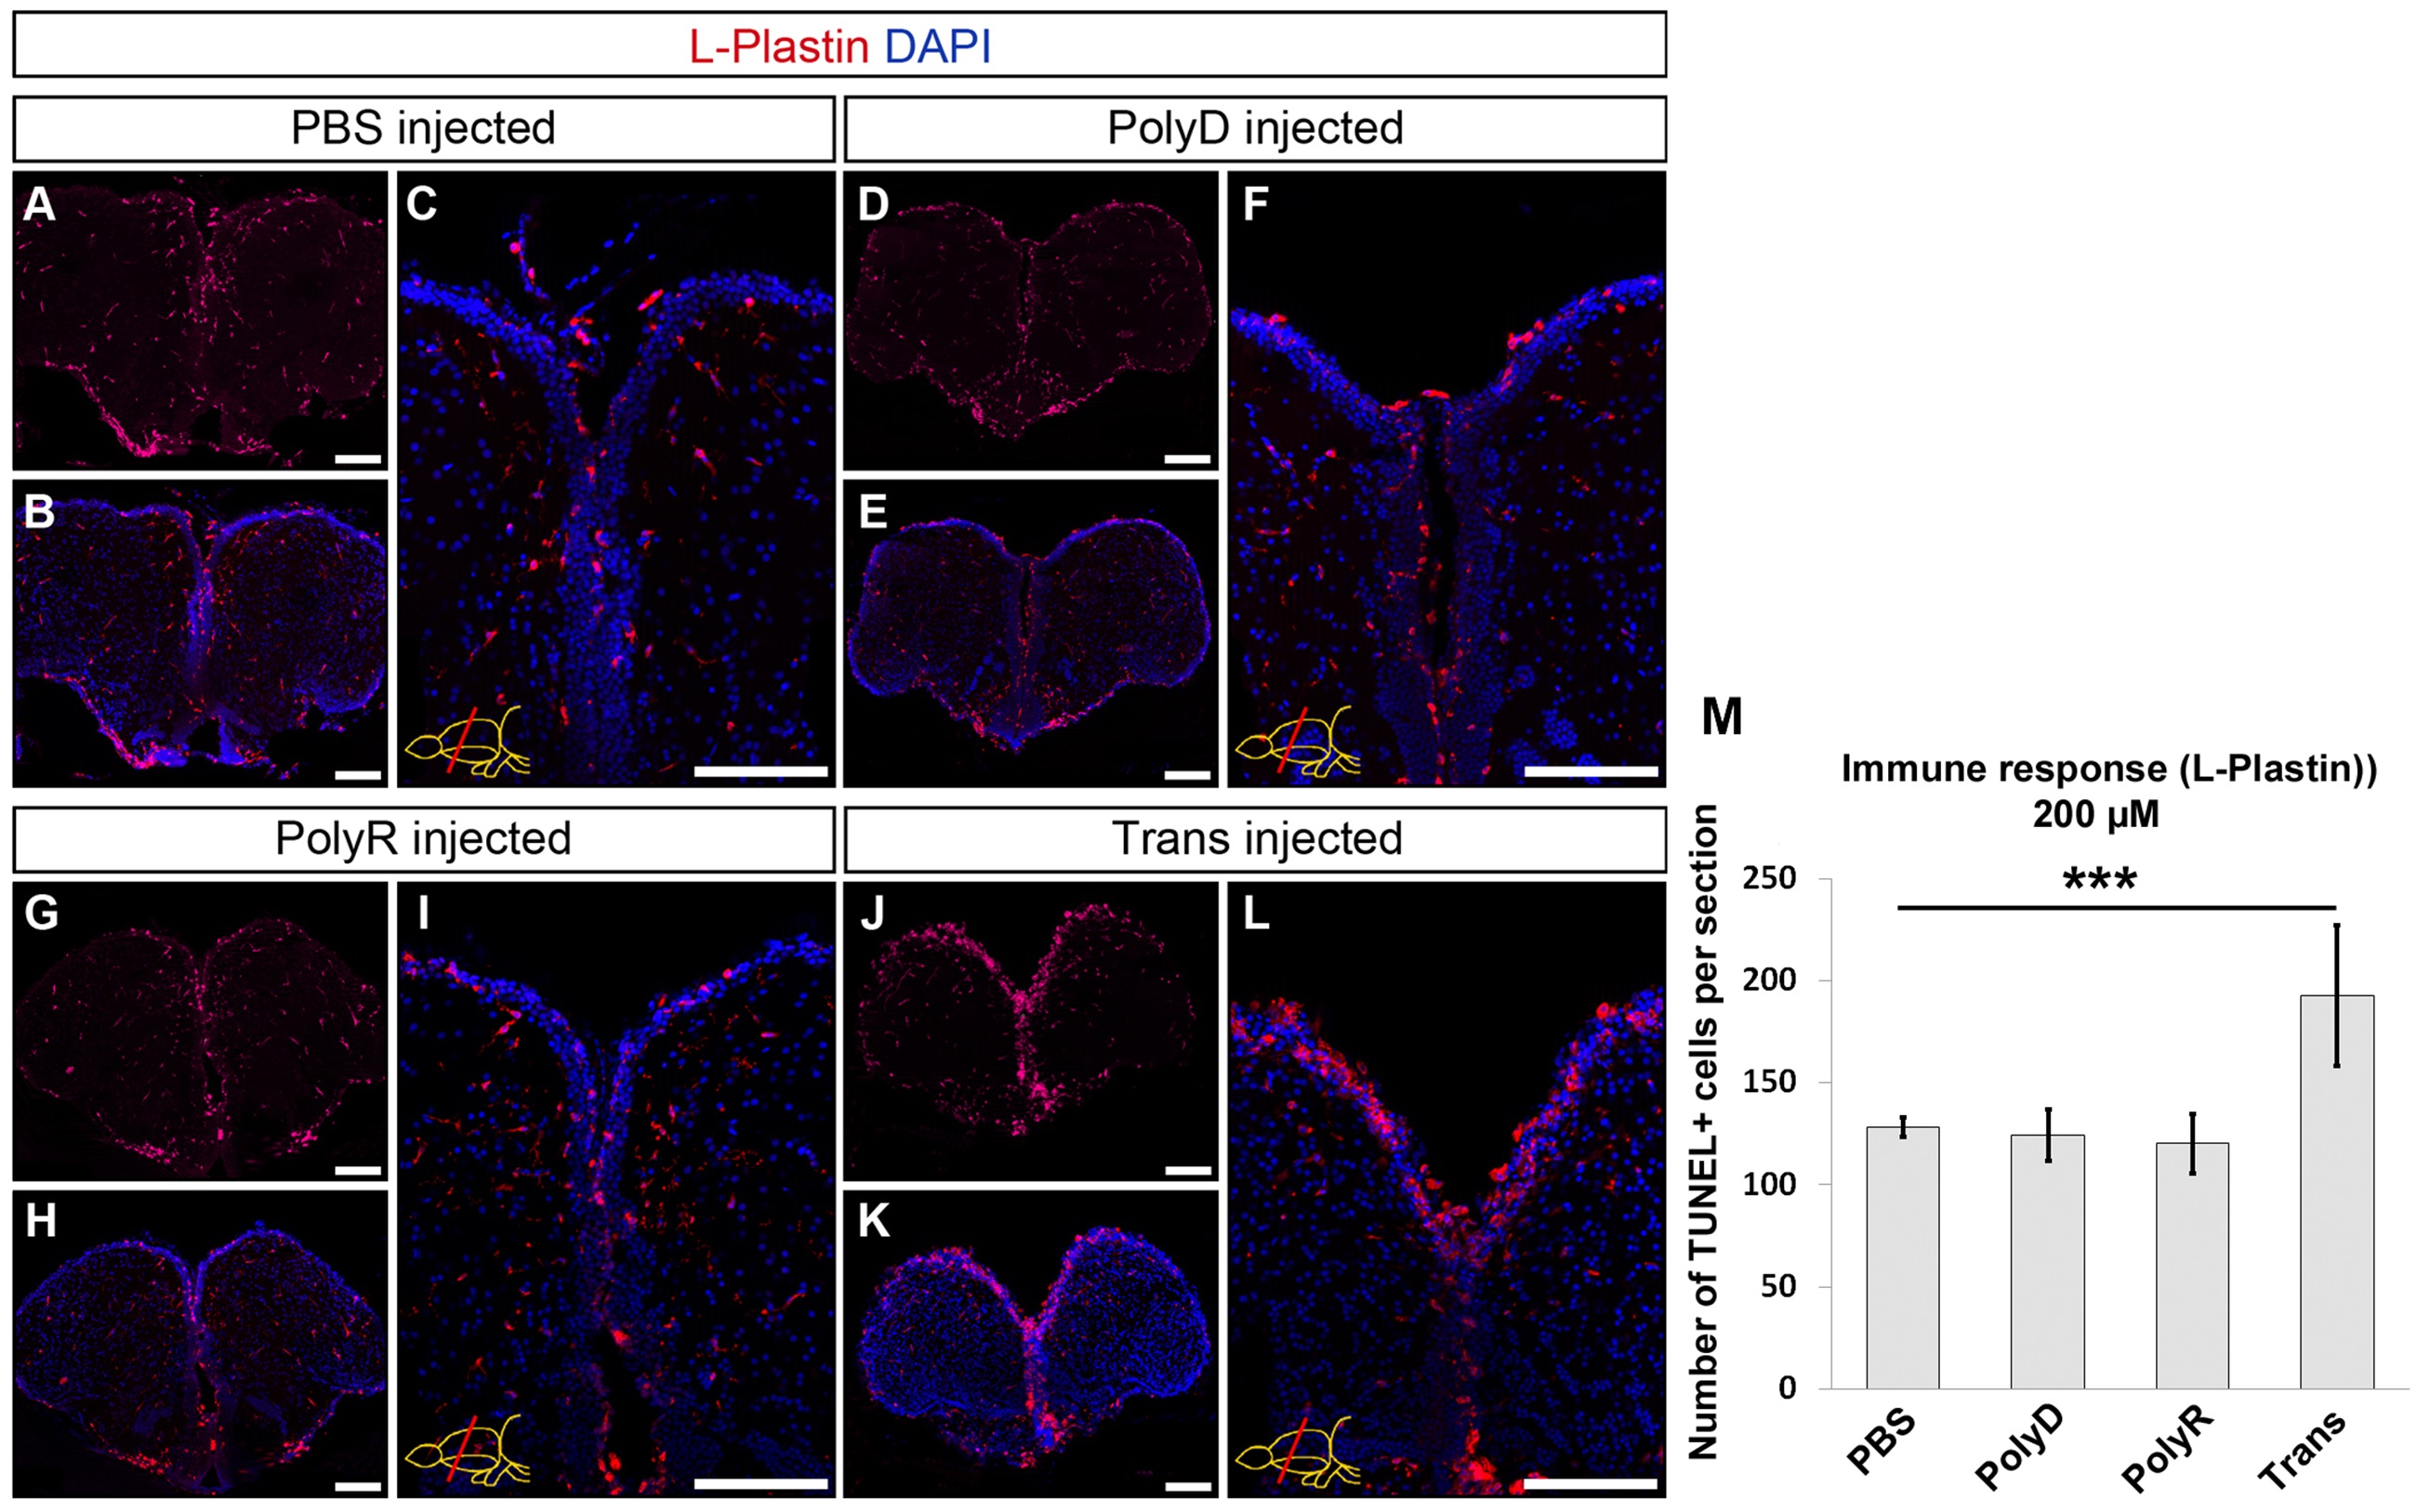
Fig. 5
Immune Response after Peptide Injection.
(A) L-Plastin immunohistochemistry (IHC) on PBS injected brain, used as control. (B) DAPI counterstaining on A. (C) Magnified medial ventricular region of B. (D) L-Plastin IHC upon PolyD injection and DAPI counterstaining (E). (F) High magnification of medial ventricular region of E. (G) L-Plastin IHC on PolyR injected brain and DAPI counterstaining (H). (J) L-Plastin IHC on Trans injected brain. (K) DAPI counterstaining on J and high magnification of medial ventricular region (L). (M) Graph depicts the quantification of L-Plastin-positive cells per telencephalic hemisphere. Scale bars: 100 µm, n = 3, data are mean + s.e.m.