
|
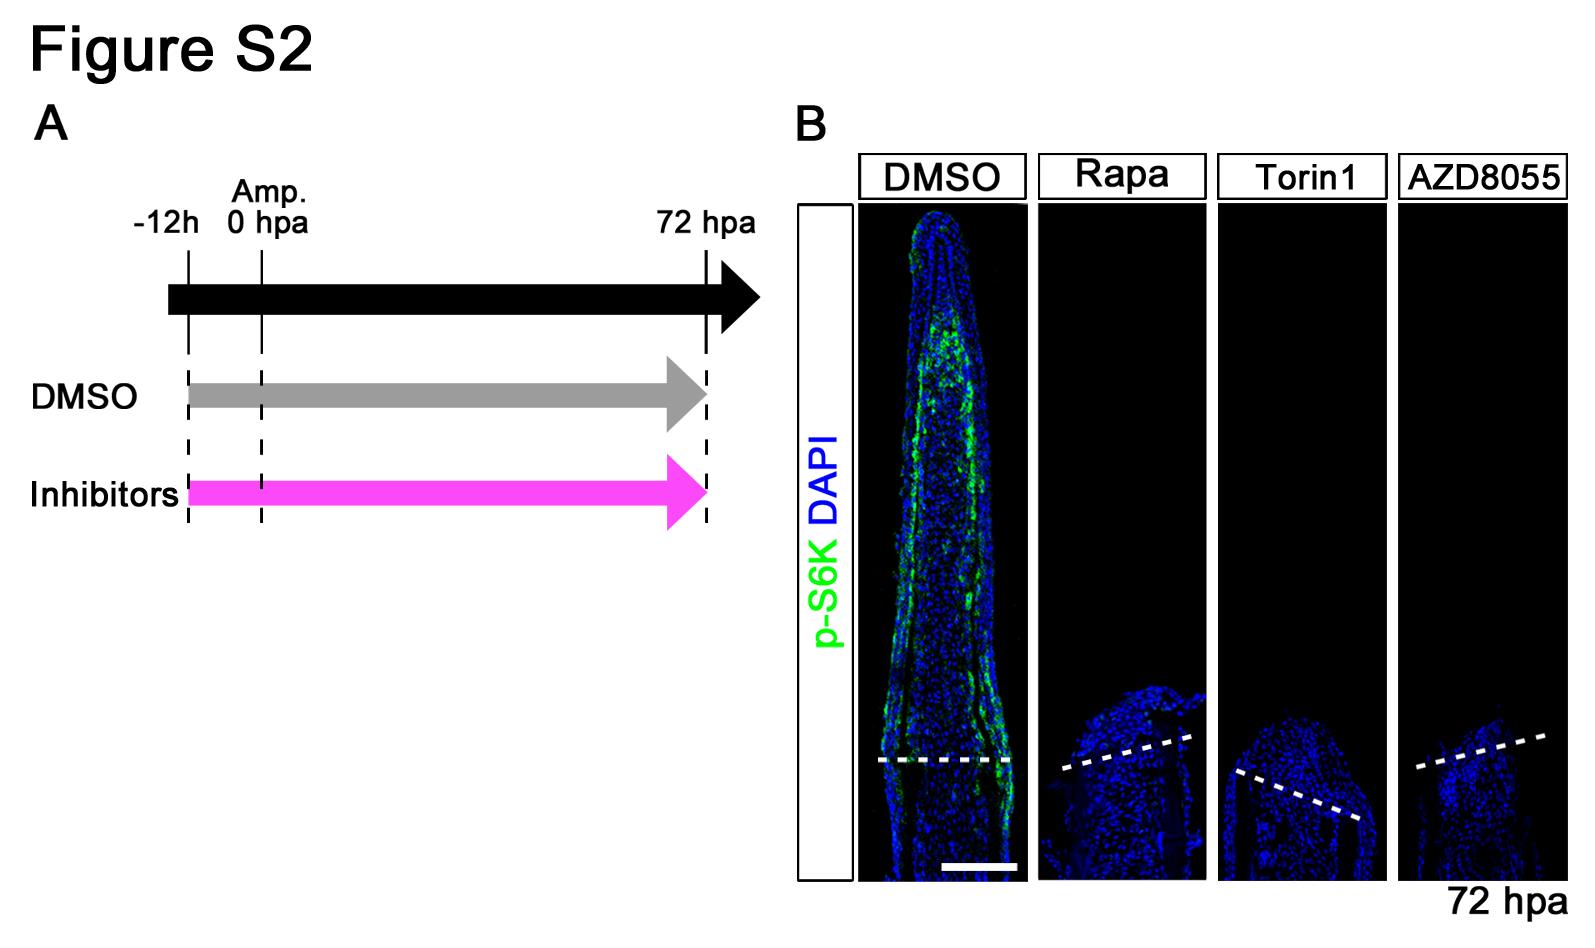
Fig. S2 Distributions of p-S6K in rapamycin, Torin1, or AZD8055-treated fin regenerates at 72 hpa. (A) Scheme of rapamycin, Torin1, or AZD8055 treatment from – 12 h to 72 hpa. (B) Longitudinal sections of wild-type fin regenerates that were immunohistochemically stained with an antibody against p-S6K (green) at 72 hpa (DMSO, n = 5; Rapa, n = 3; Torin1, n = 3; AZD8055, n = 3). DAPI fluorescent signal (blue) indicates the presence of nuclei. At 72 hpa, the p-S6K fluorescent signal was lost in rapamycin, Torin1, or AZD8055- treated fin regenerates. Dashed white lines indicate the amputation plane. Scale bars: 100 µm.