
|
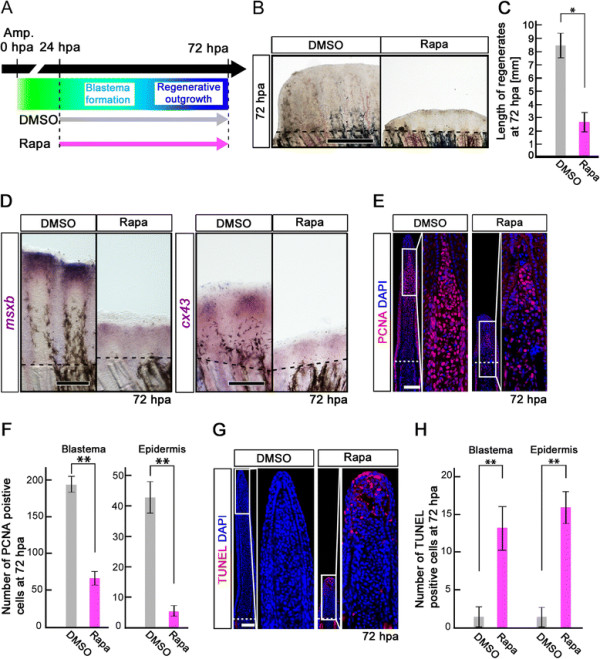
Fig. 5
Rapamycin treatment inhibits both the proliferation and survival of intra-ray cells during the blastema formation and regenerative outgrowth stages. (A) Scheme of rapamycin treatment during blastema formation and regenerative outgrowth stages. (B, C) Rapamycin treatment significantly blocked the outgrowth of fin regenerates at 72 hpa. *p < 0.05 by Student’s t-test. Error bars represent the standard error of 4 independent experiments. Scale bars: 500 µm. Dashed lines indicate the amputation plane. (D) Expression of msxb and cx43 was examined by whole-mount in situ hybridization at 72 hpa (msxb, n = 5; cx43, n = 3). Rapamycin treatment induced the down-regulation of msxb and cx43 expression. Scale bars: 200 µm. Dashed lines indicate the amputation plane. (E, F) PCNA-stained fin sections and quantification of PCNA-positive cells in the intra-ray and epidermis at 72 hpa. The number of PCNA-positive cells was significantly reduced by rapamycin treatment in both the blastema and epidermis at 72 hpa. **p < 0.01 by Student’s t-test. Error bars represent the standard error of 4 independent experiments. Scale bars: 100 µm. (G, H) TUNEL-stained fin sections and quantification of TUNEL-positive cells in the intra-ray and epidermis. Cell death was significantly increased by rapamycin treatment in both the blastema and epidermis at 72 hpa. **p < 0.01 by Student’s t-test. Error bars represent the standard error of 4 independent experiments. Scale bars: 100 µm. DAPI fluorescent signal (blue) indicates the presence of nuclei (E, G).