
Image
|
Figure Caption
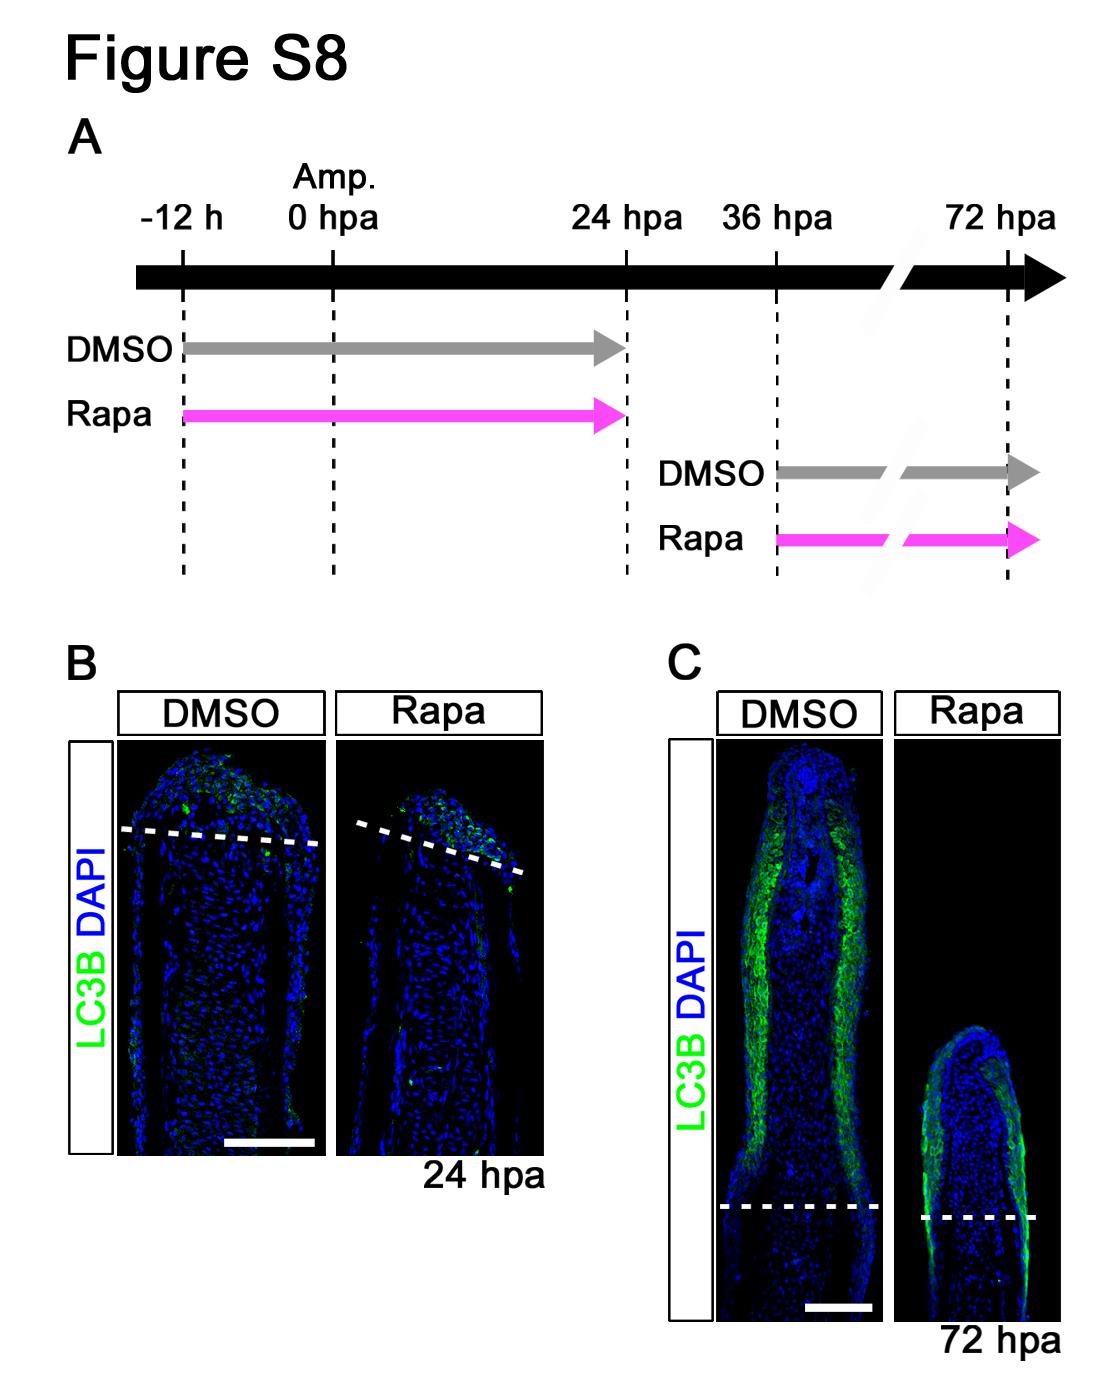
Fig. S8 Distributions of LC3B in rapamycin treated fin regenerates. (A) Scheme of rapamycin treatment from -12 to 24 hpa or from 36 to 72 hpa. (B,C) Longitudinal sections of DMSO or rapamycin treated wild-type fin regenerates that were immunohistochemically stained with an antibody against LC3B (green) at 24 hpa (DMSO, n = 4; Rapa, n = 4) and 72 hpa (DMSO, n = 3; Rapa, n = 3). DAPI fluorescent signal (blue) indicates the presence of nuclei. LC3B is specifically localized in the wound epidermis at 24 and 72 hpa. Dashed white lines indicate the amputation planes. Scale bars: 100 µm.
Acknowledgments
This image is the copyrighted work of the attributed author or publisher, and
ZFIN has permission only to display this image to its users.
Additional permissions should be obtained from the applicable author or publisher of the image.
Full text @ BMC Dev. Biol.