
|
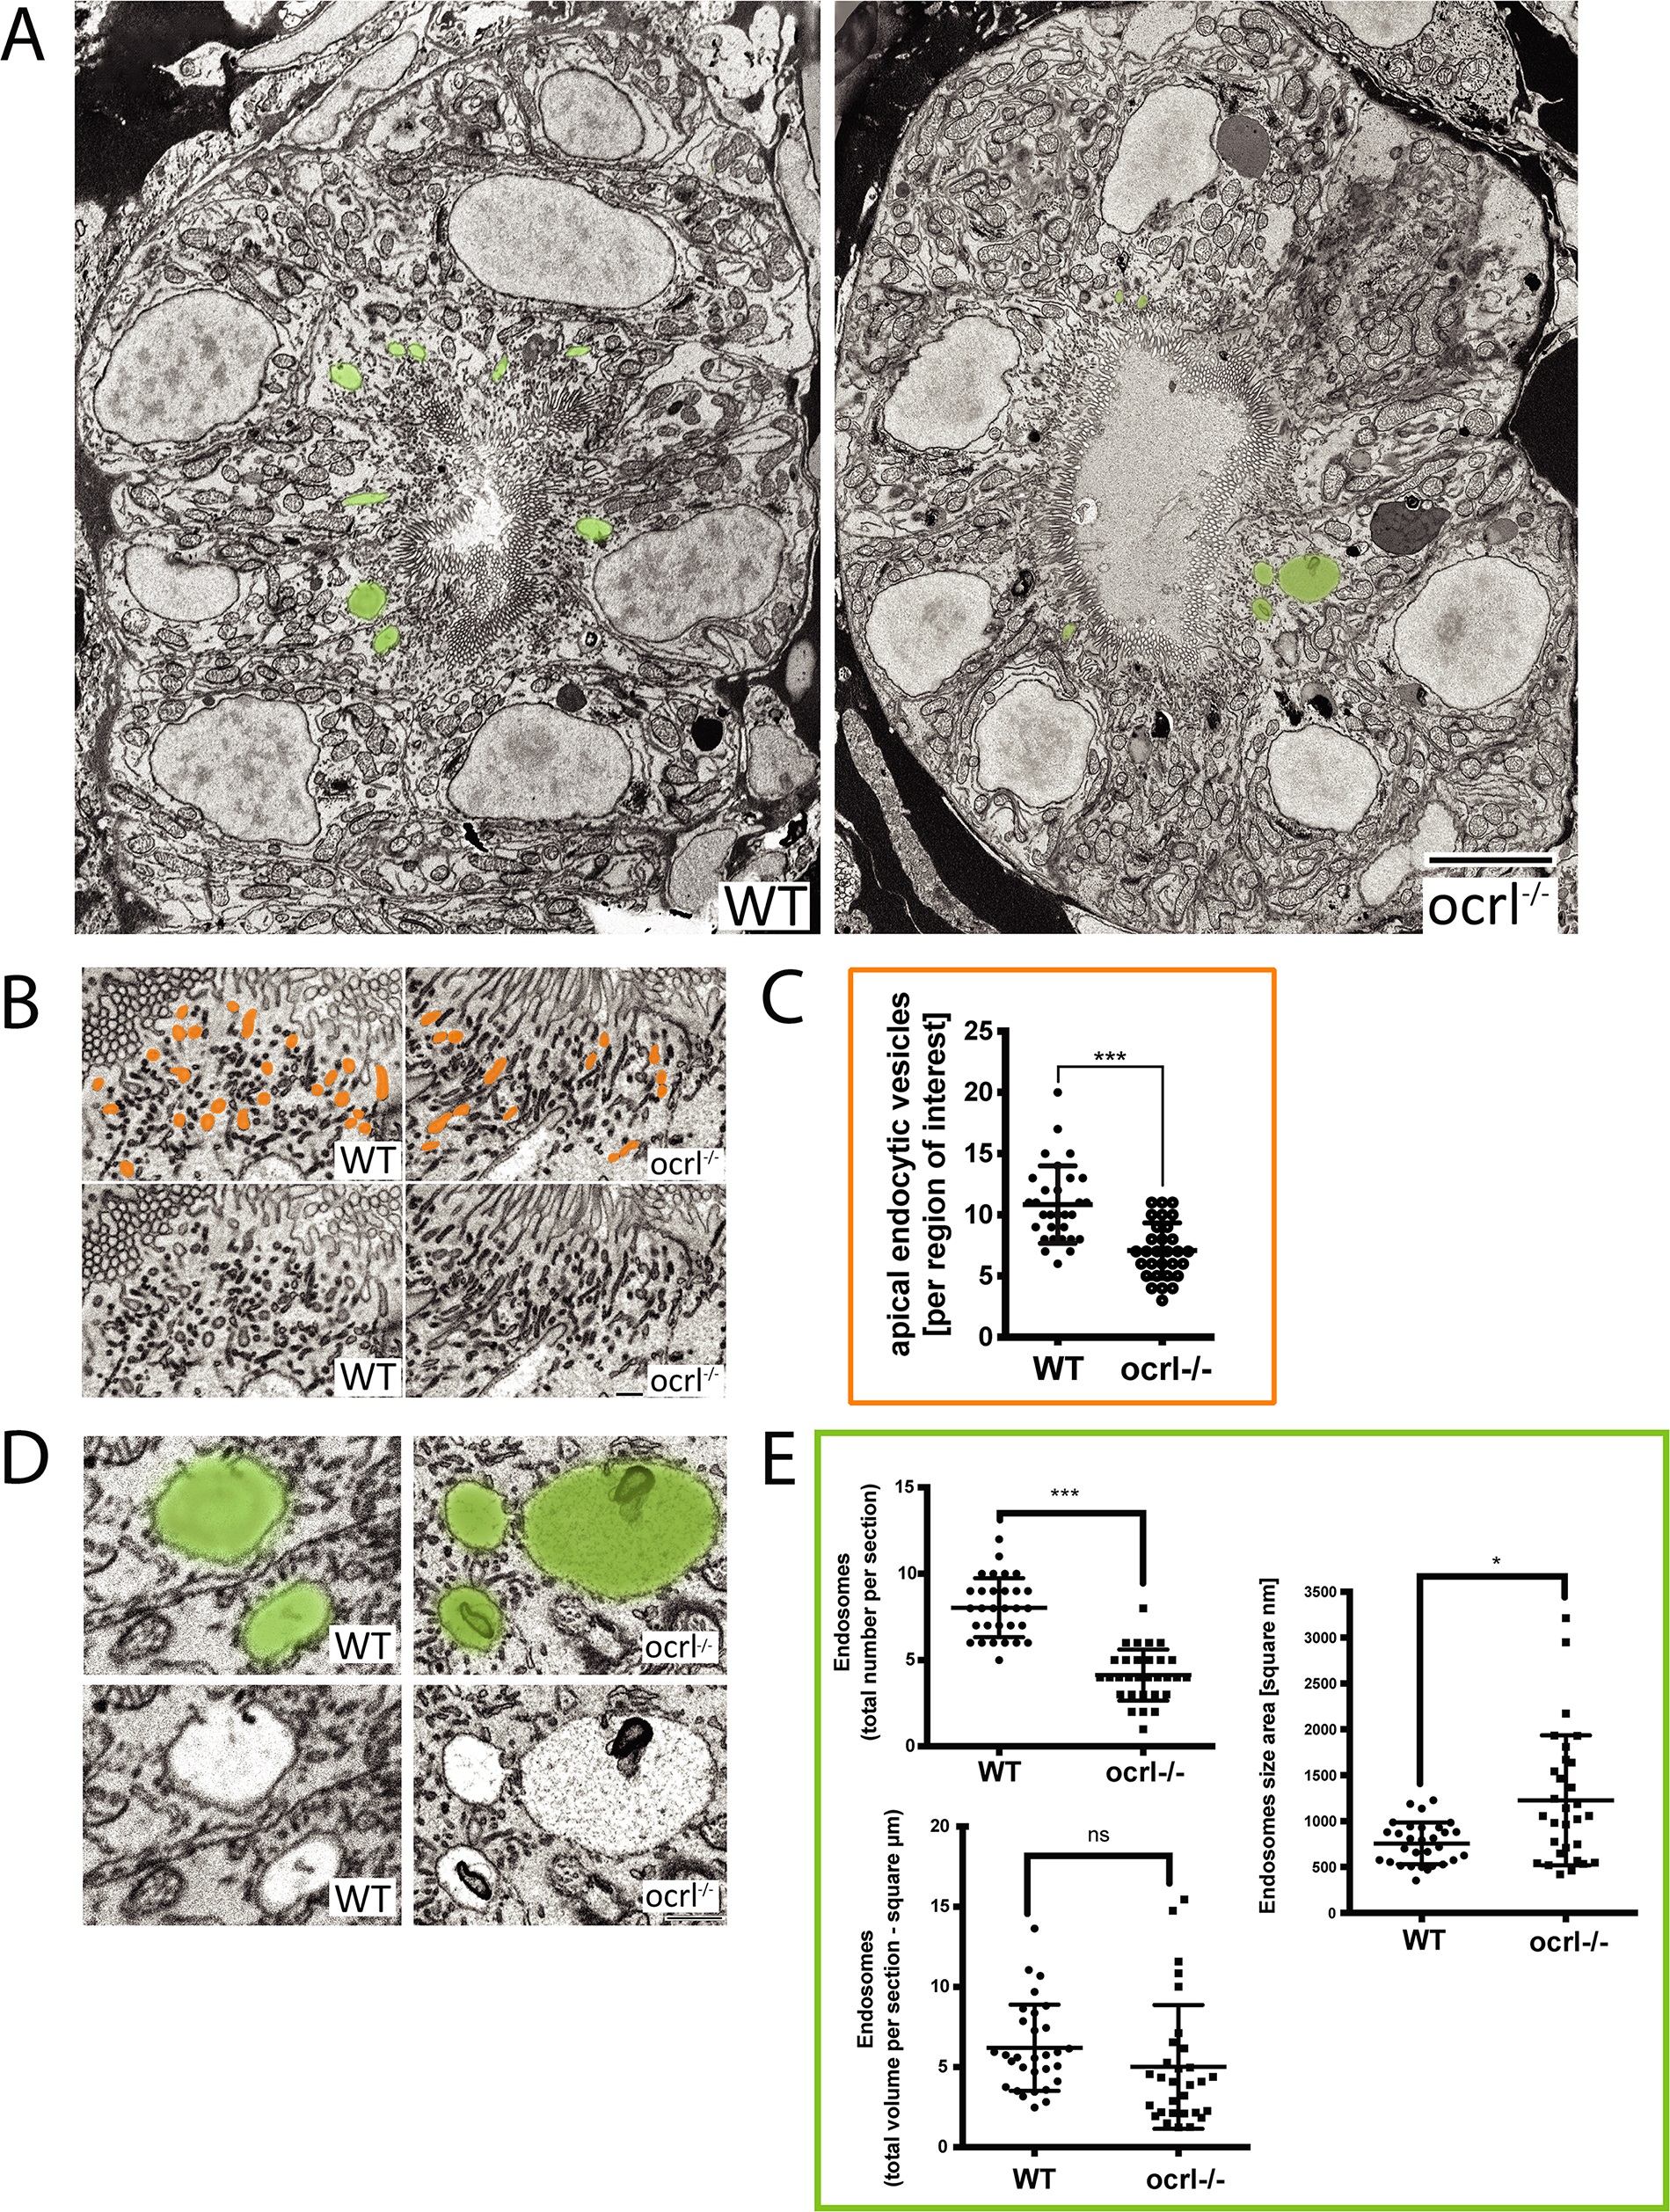
Fig. 4
Electron microscopy analysis of endocytic compartments in OCRL1 deficient pronephros.
A. Block face scanning electron microscopy (SEM) images of transverse sections through the zebrafish proximal pronephric tubule of wild-type and ocrl-/- mutant 72 hpf embryos. The apical membrane, identified by numerous microvilli, lines the central lumen of the pronephric tubule. Vacuolar endosomes are false coloured in green. B and D. Block face SEM showing apical endocytic vesicles at the apical pole of pronephric proximal tubule cells (false coloured in orange in top row) (B) and vacuolar endosomes (false coloured in green in top row) (D). C and E. Quantification of endocytic compartments. Numbers of apical endocytic vesicles were counted per region of interest (C), and vacuolar endosome number, size and total area were counted per entire section (E). Data are presented as the mean ± SD. Statistical analysis was performed using the unpaired t-test. ***p < 0.0001. Scale bars represent 5 µm (A), 2 µm (D) or 1 µm (B).