
|
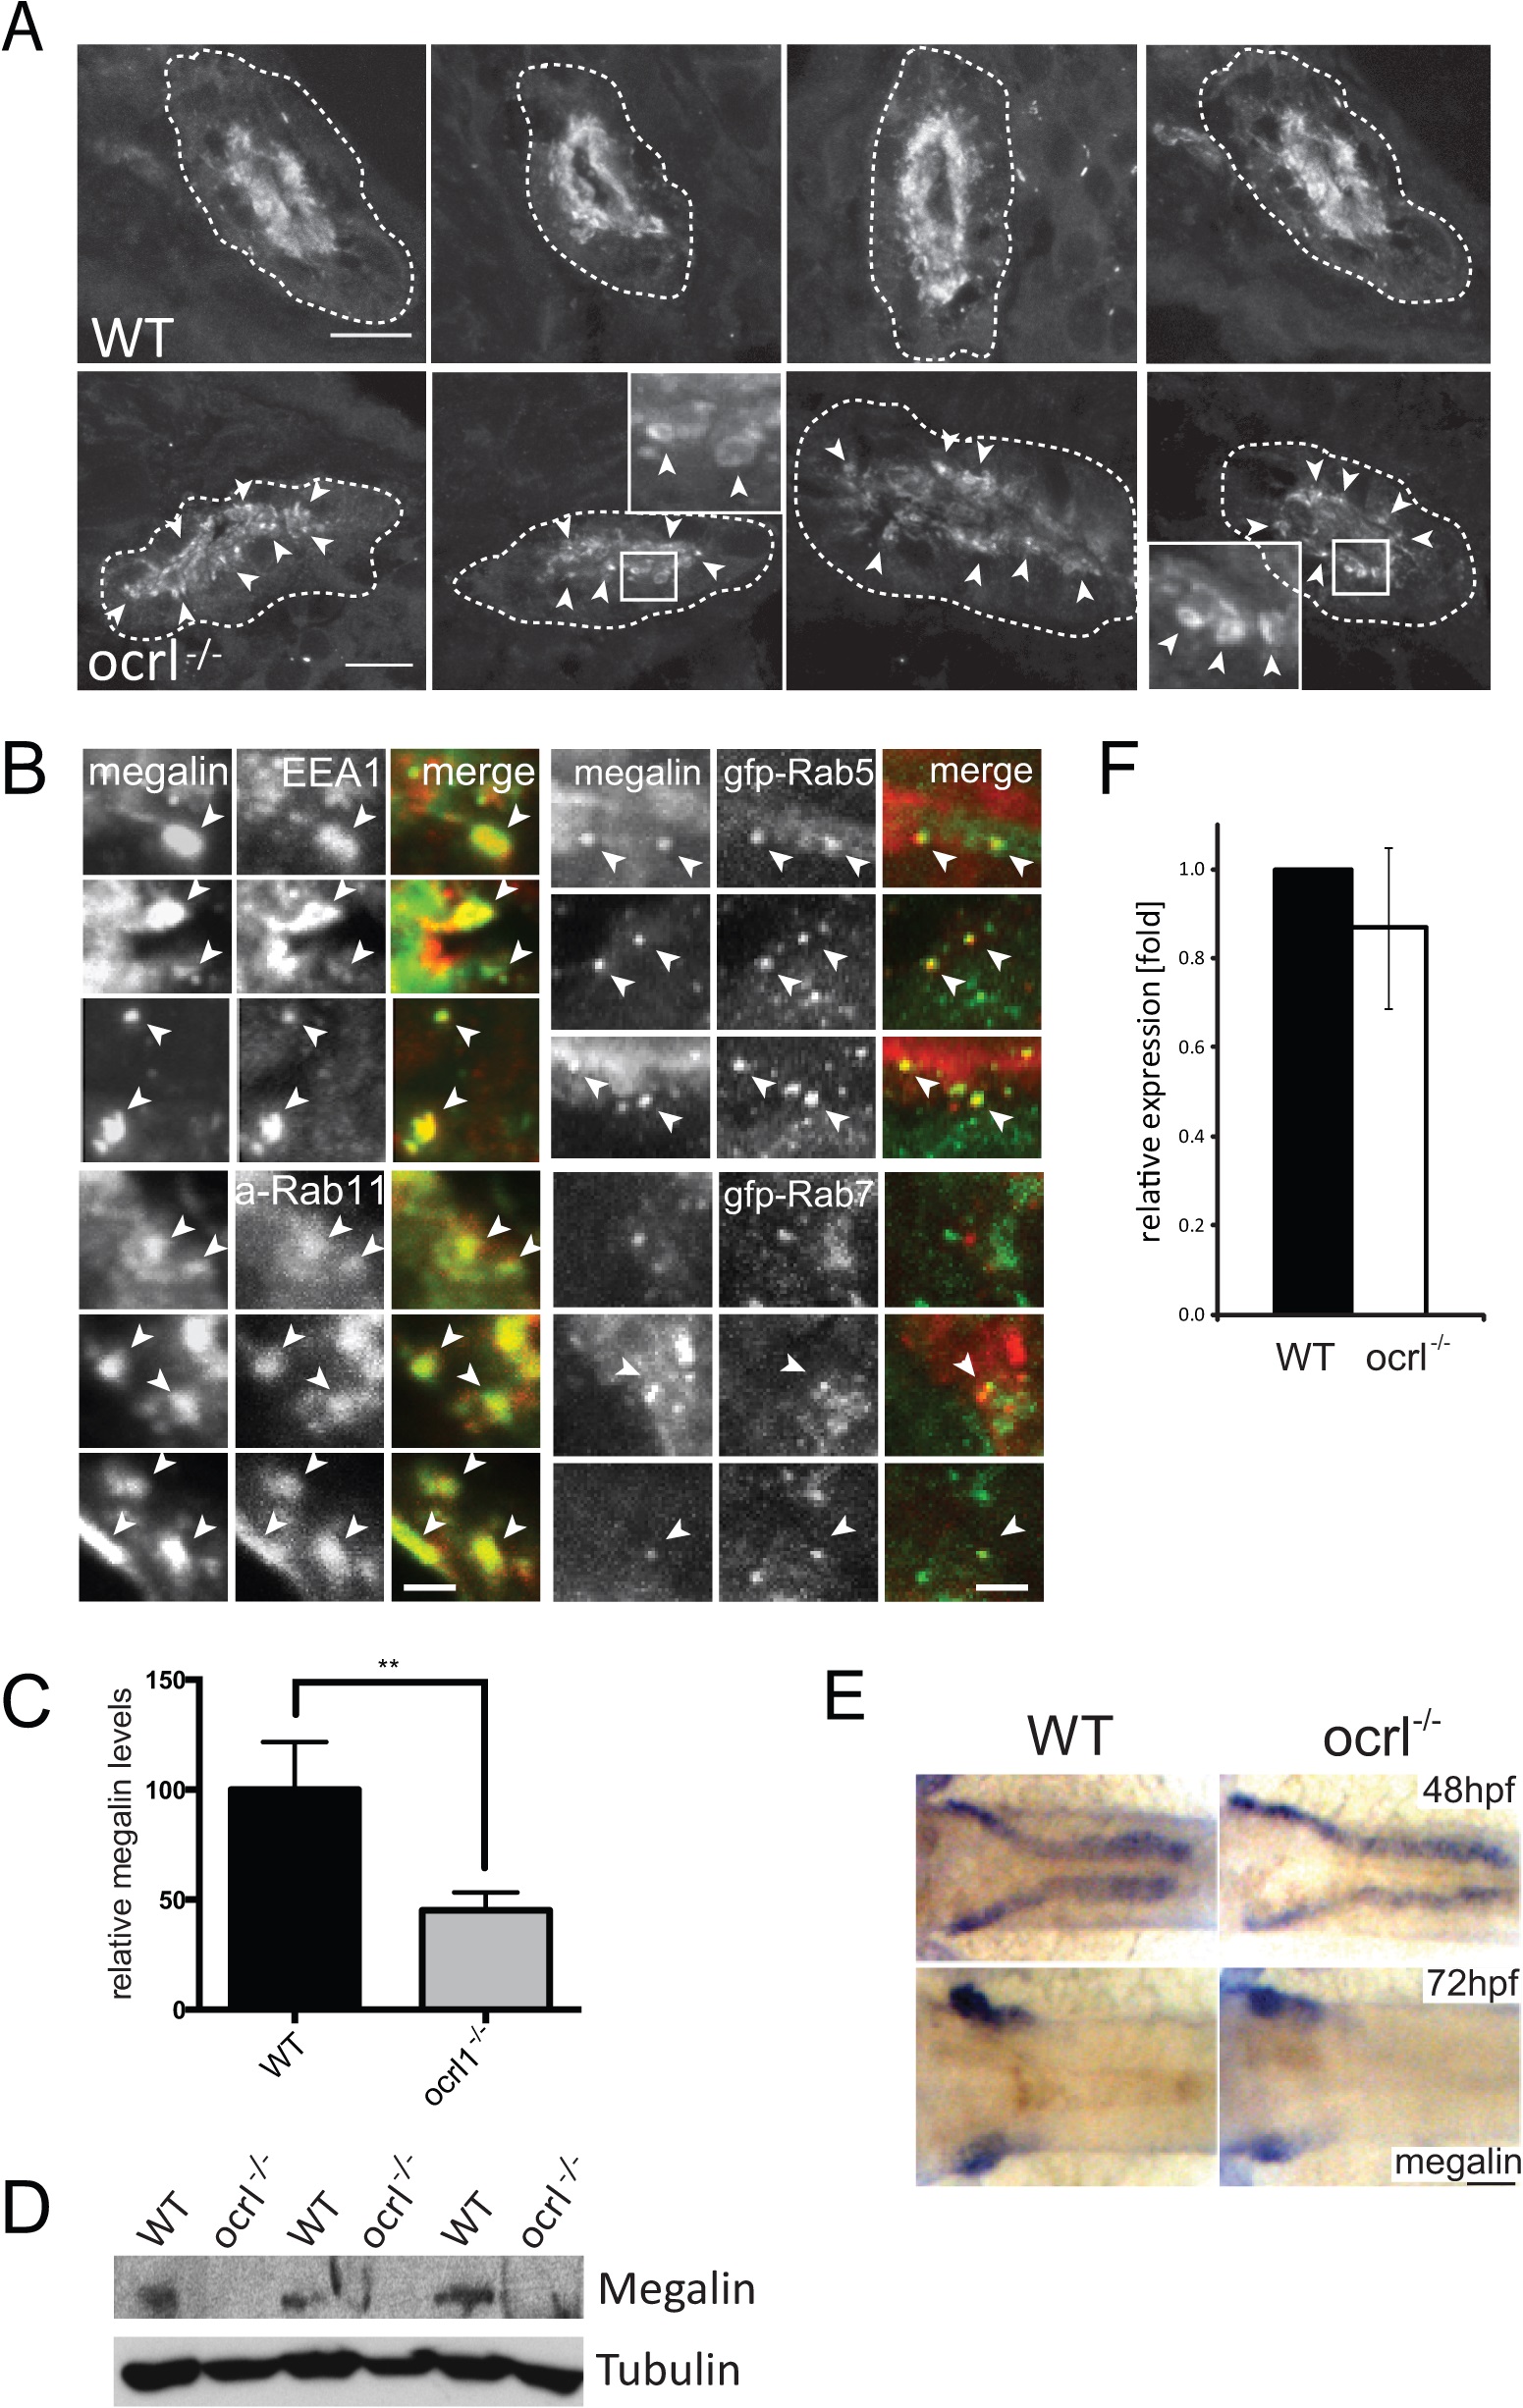
Fig. 2
Megalin transcript and protein analysis in OCRL1-deficient zebrafish embryos.
A. Transverse confocal images of the proximal pronephric region of wild-type (WT) and ocrl-/- mutant 72 hpf embryos labelled with anti-megalin antibodies. The white dashed lines indicate the outline of pronephric tubules. Arrowheads indicate sub-apical punctate and vacuolar megalin staining. B. Transverse confocal images of the proximal pronephric region of 72 hpf ocrl-/- embryos labelled with antibodies to megalin (green in left panel, red in right panel) and EEA1 (red) or GFP (gfp-, green) to detect ectopically expressed Rab5 or Rab7. mApple (a-) tagged Rab11 is in red. Arrowheads indicate colocalisation. C. Quantification of the relative fluorescence levels of megalin in confocal transverse sections of the indicated embryo types. D. Western blot of 72 hpf wild-type (WT) or ocrl-/- embryos with antibodies to megalin and tubulin. Three equivalent samples for genotype are analyzed. E. In situ hybridisation of megalin transcript in 48 hpf (top) and 72 hpf (bottom) wild-type (WT) or ocrl-/- embryos. F. Quantitative RT-PCR (qPCR) of megalin transcript levels in wild type and ocrl-/- embryos at 72 hpf. Data are presented as the mean ± SD. Statistical analysis was performed using the unpaired t-test. ***p < 0.0001. Scale bars in A, B and E represent 10, 2 and 20 µm respectively.