
|
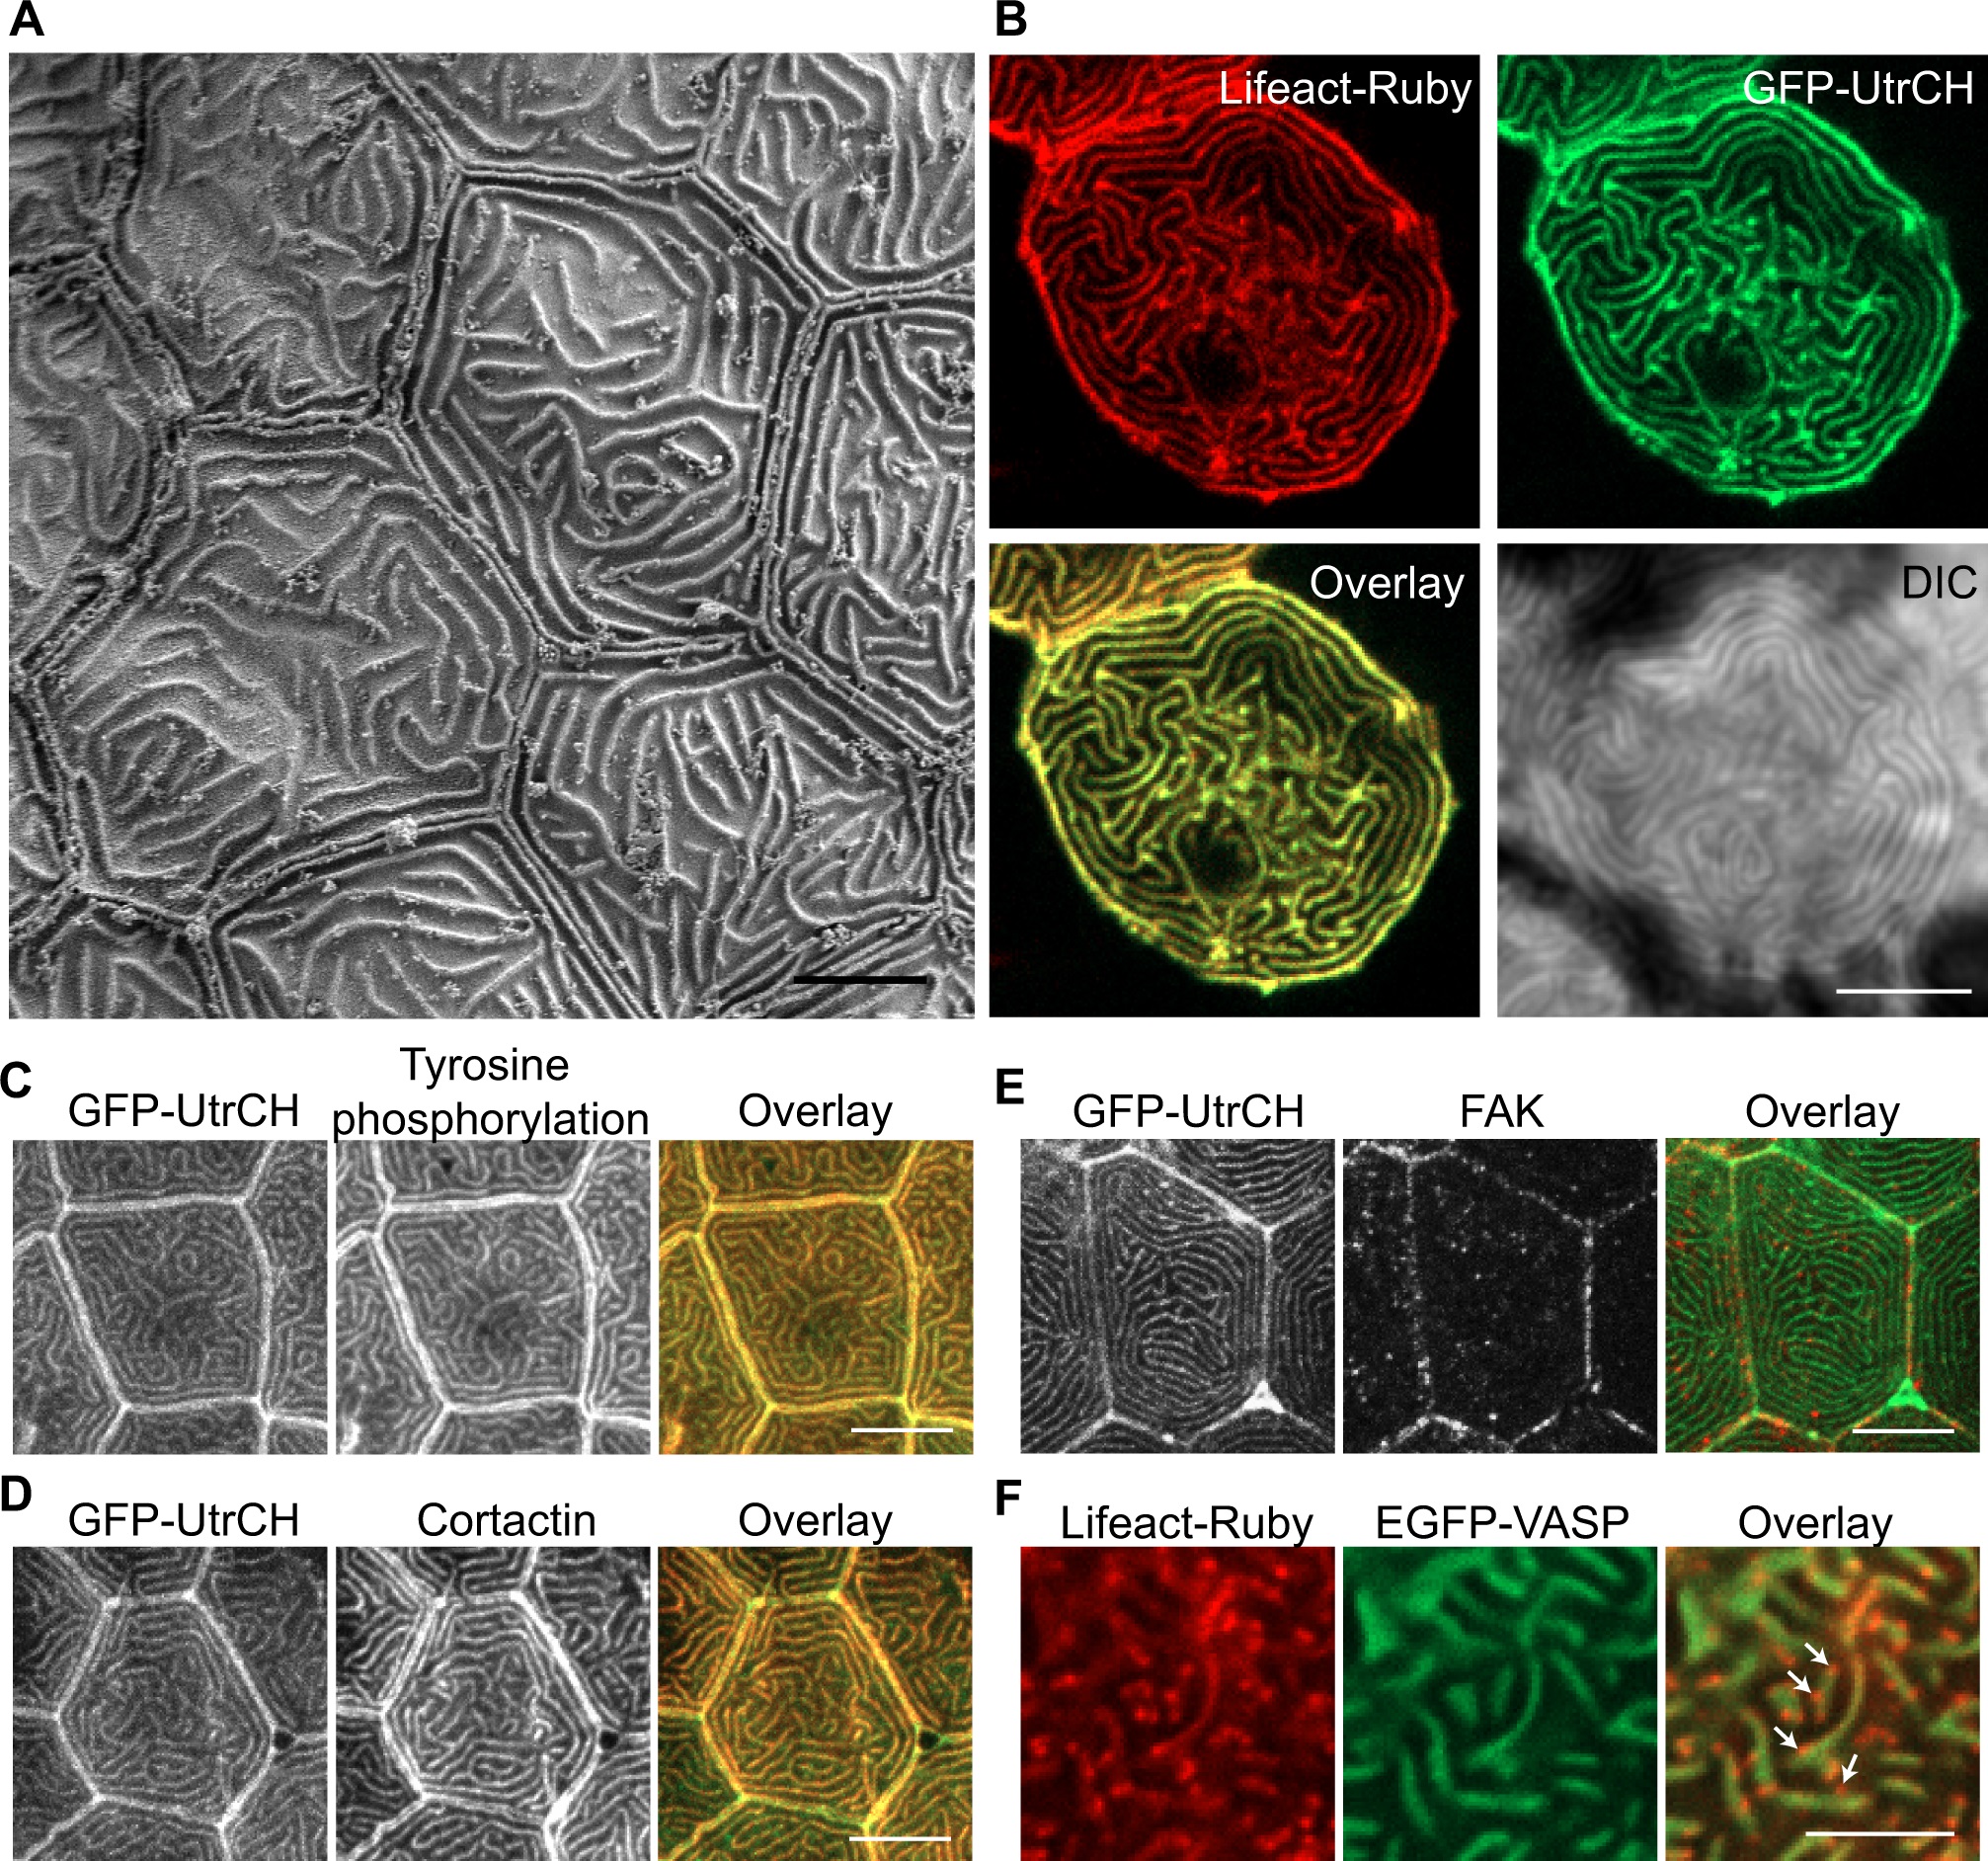
Fig. 1 Microridge structure and composition.
(A) Scanning electron microscopy on zebrafish larvae at 2 days post fertilization (dpf) in the area of the trunk. Scale bar, 5 µm. (B) Single plane confocal images of epithelial cells expressing actin bioprobes Lifeact-Ruby and GFP-UtrCH, which label all F-actin and stable F-actin, respectively. Signal from Lifeact-Ruby and GFP-UtrCH colocalize. Scale bar, 10 µm. (C-E) Tg(krt4-GFP-UtrCH) larvae at 2.5 dpf were fixed and immunostaining was performed using anti-phosphotyrosine antibody 4G10 (C), anti-cortactin antibody (D) or anti-FAK antibody (E). Scale bar, 10 µm. (F) Single plane confocal images of epithelial cells expressing actin bioprobe Lifeact-Ruby and EGFP-VASP. VASP localizes to a subset of Lifeact labeled microridges (S1 Movie). Arrows indicate regions of Lifeact labeling that did not colocalize with VASP. Scale bar, 5 µm.