
|
Fig. 4
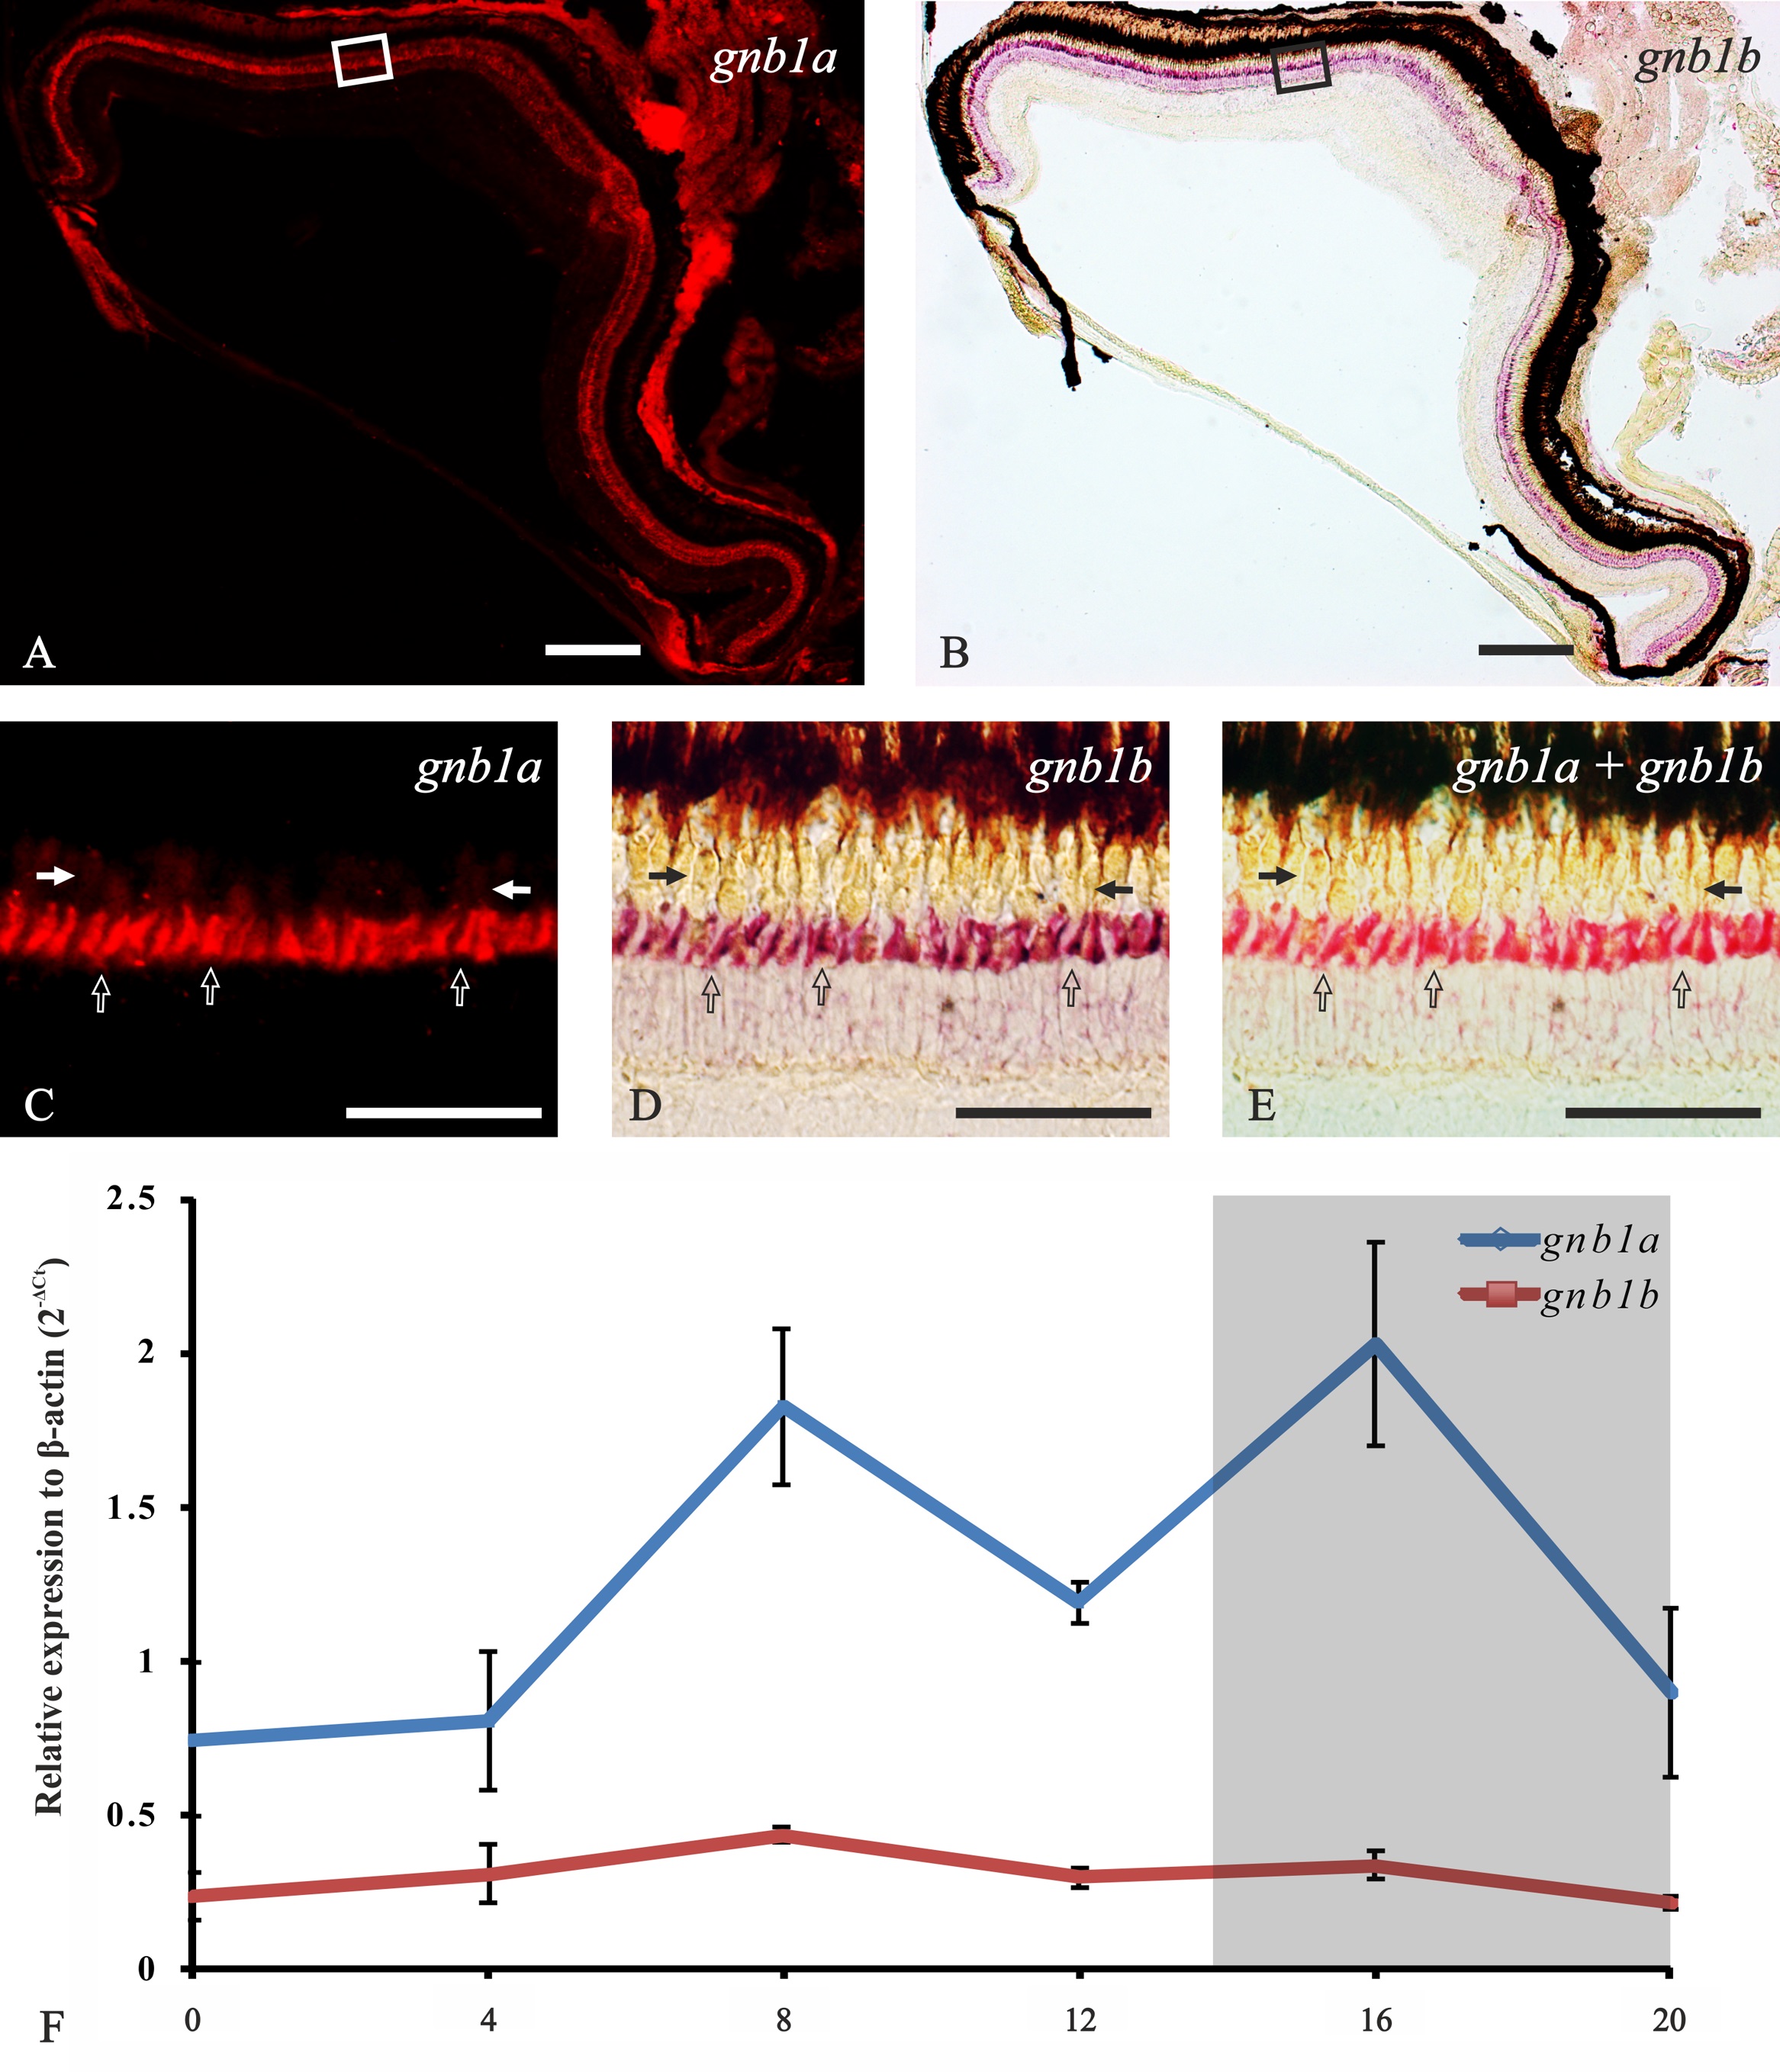
Co-expression of gnb1a and gnb1b genes in the adult zebrafish retina.
Photomicrographs from an adult retina showing combination of gnb1a and gnb1b antisense riboprobes in a double ISH experiment. The upper row displays radial sections of the entire adult retina (dorsal side to the left), while the middle row shows higher magnification of the area marked within the square in the upper pictures (outermost side at the top). A and C are fluorescent pictures showing Fast Red staining for gnb1a. D is a bright-field picture showing mainly NBT/BCIP staining for gnb1b in purple but also a minimal red from the Fast Red. B and E pictures combine bright-field and fluorescence to show the co-expression of both mRNAs in the same rods. Empty arrows in panels C-E point at single rods and arrows mark the oil droplets region that gives autofluorescence in panel C. Scale bars are 200 µm for panels A-B and 50 µm for panels C-E. The bottom of the figure displays a graph showing the expression levels of the two genes at different Zeitgeber time points during the day (0 to 20 in X-axis) in relation to β-actin as housekeeping gene (Y-axis), using the 2-ΔCt method (F). Note that the expression level of gnb1a is significantly higher than gnb1b at all time points. Moreover, gnb1a expression oscillates, with significantly higher peaks of expression (p<0,05) at ZT8 and ZT16, while gnb1b does not oscillate.