
|
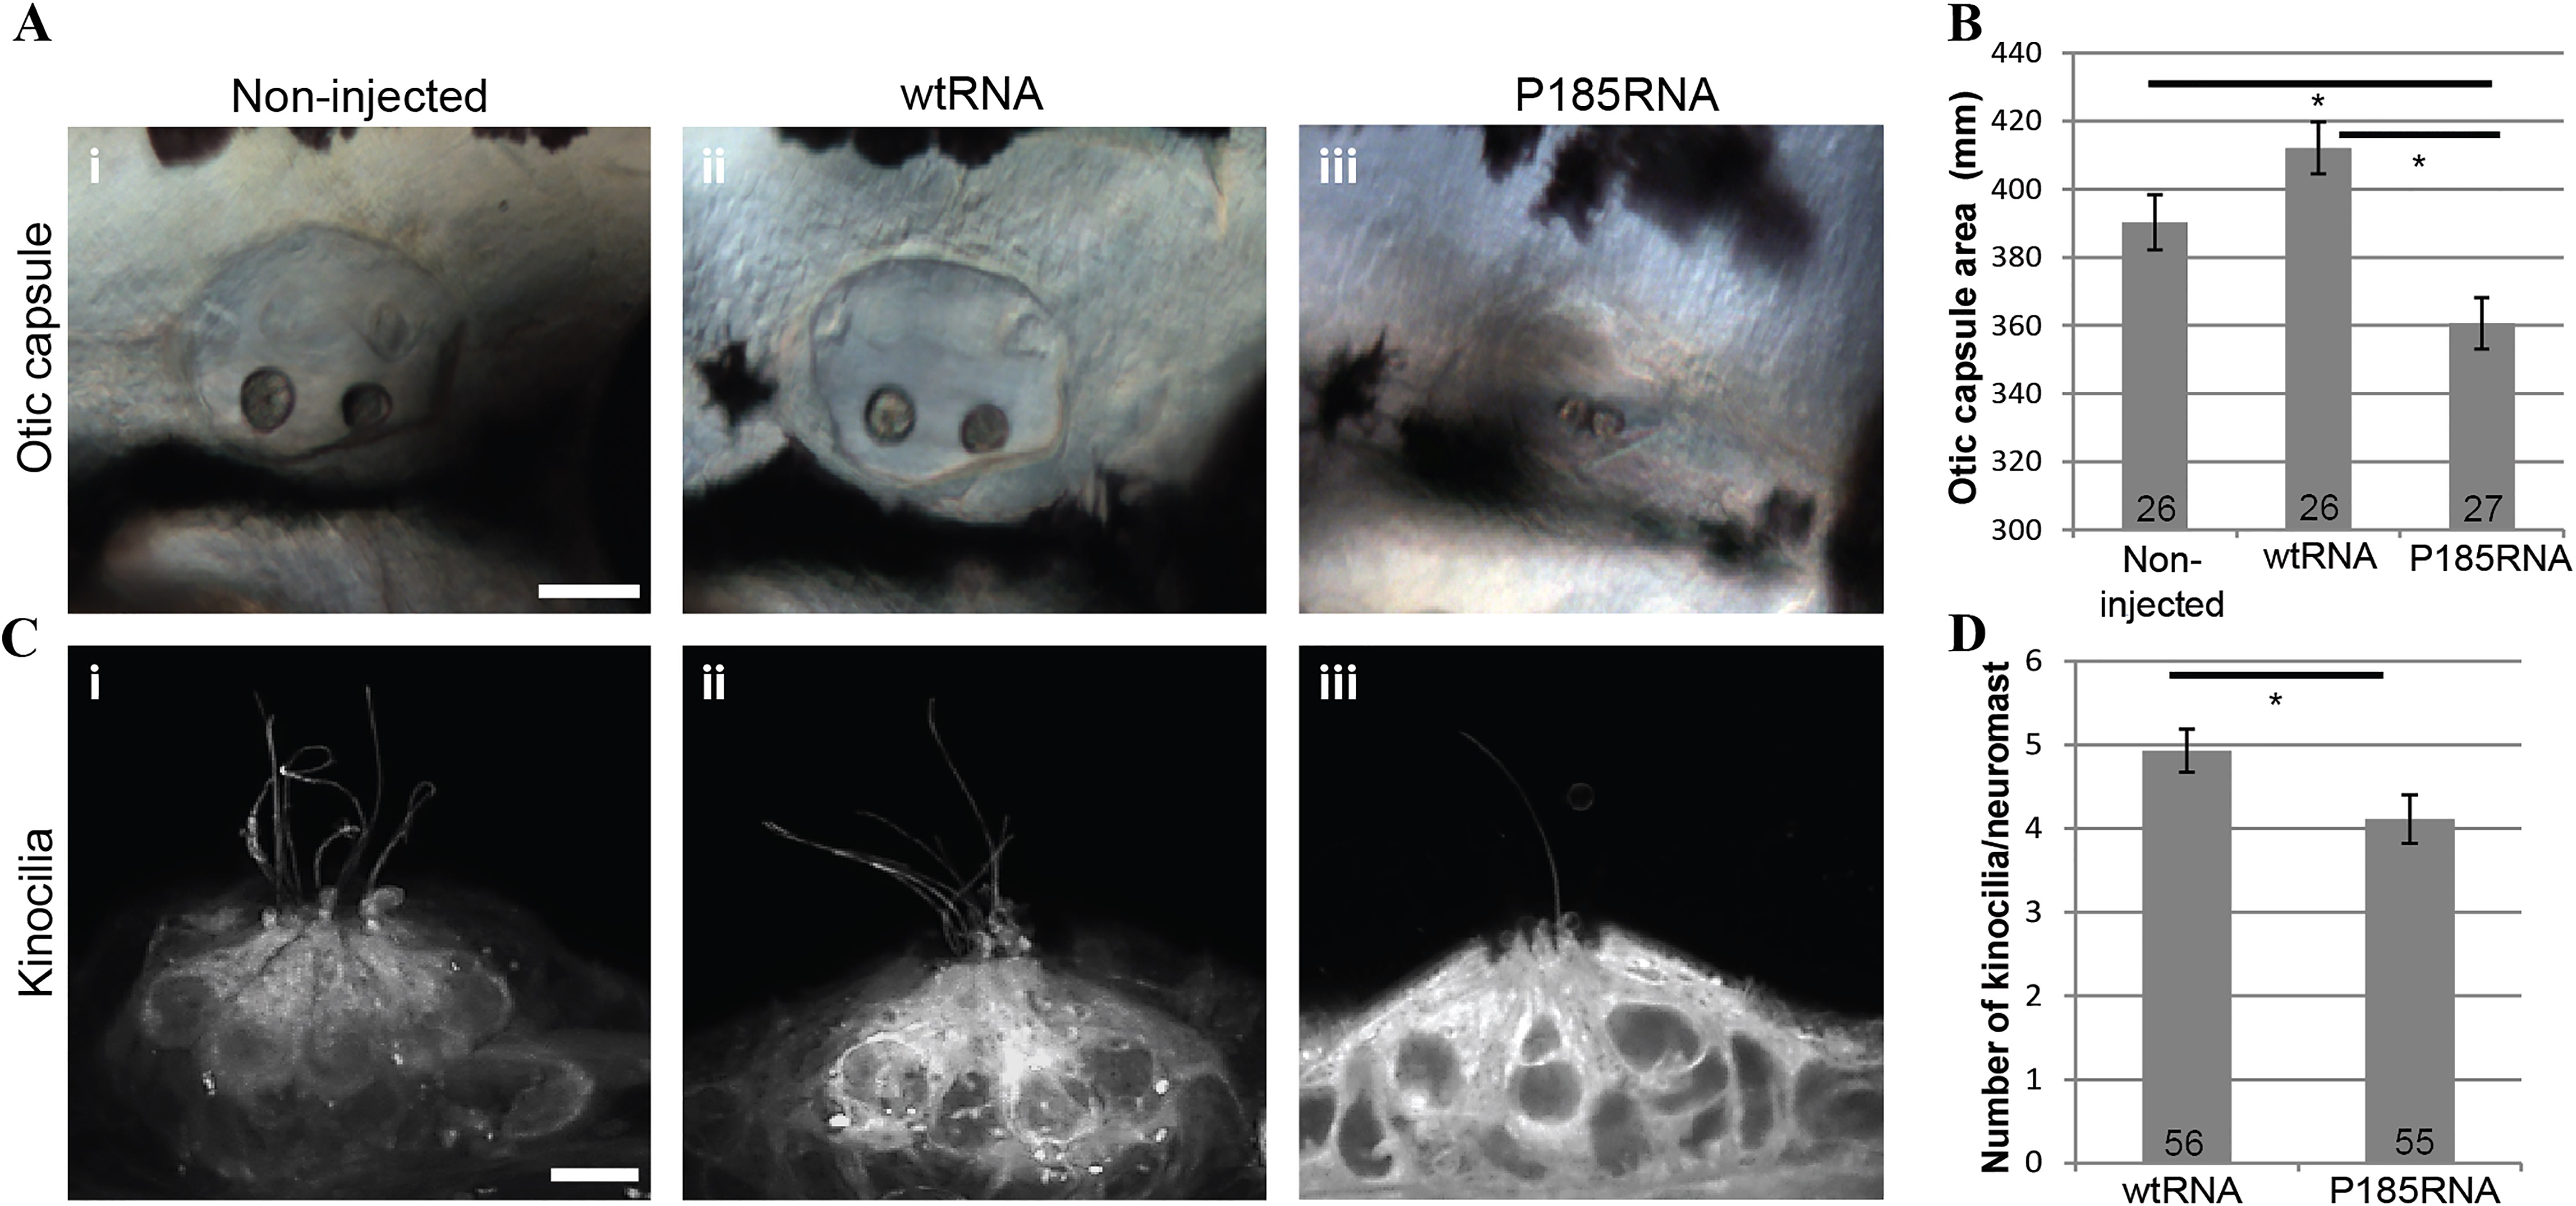
Fig. 3
Over-expression of wtRNA and P185RNA in zebrafish embryos.
(A) Otic capsule morphology in non-injected (i, n = 26), wtRNA-injected (ii, n = 26) and P185RNA-injected (iii, n = 27) embryos at 72 hpf. Scale bar represents 50µm. Embryos are mounted anterior to the left. (B) Comparison of otic capsule morphology between WT and mutant RNA injected zebrafish shows reduced inner ear size in mutant RNA injected larvae (p<0.001). (C) Hair cell kinocilia in P185RNA-injected larvae (iii) show fewer kinocilia as compared to non-injected (i) and wtRNA-injected larvae (ii). Scale bar represents 5µm. (D) Kinocilia count per neuromast comparison between wtRNA-injected (n = 56) and P185RNA-injected (n = 55). All data are presented as the mean ± SEM and are derived from at least triplicates (*P < 0.05 as compared with controls considered significant).