
|
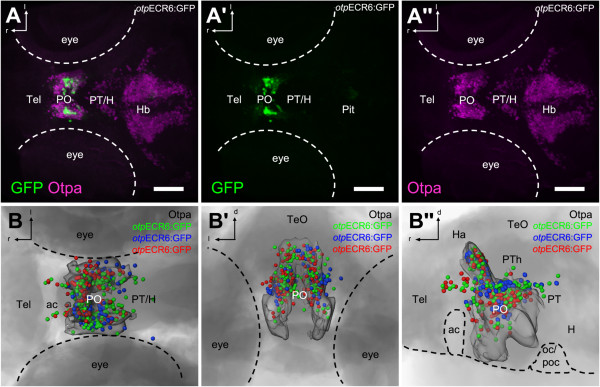
Fig. 3
otpECR6 displays enhancer activity in the forebrain with expression in cells localizing within the caudal telencephalon and dorsal half of the preoptic Otpa domain.A, Confocal z-stack maximum projection of an immunohistochemically stained 5 dpf Tg(otpECR6-E1b:mmGFP) larva double-labeled for GFP (A′) and Otpa (A′′). B, Reconstructed localization and variability of GFP-expressing cells. Colors represent three representative maps derived from three different animals after registration using the outlines of the Otpa signal as references (transparent surface). Abbreviations: Tel, telencephalon; PO, preoptic area; PT, posterior tuberculum; H, hypothalamus; Hb, hindbrain; Pit, pituitary; ac, anterior commissure; TeO, optic tectum; Ha, habenula; PTh, prethalamus; oc, optic chiasm; poc, postoptic commissure; r, rostral; l, lateral; d, dorsal. Scale bars: 100 µm.