
Fig. 4
- ID
- ZDB-IMAGE-150528-4
- Genes
- Publication
- Liu et al., 2015 - DNA methyltransferase 1 functions through C/ebpa to maintain hematopoietic stem and progenitor cells in zebrafish
- All Figures
- Figures for Liu et al., 2015
|
Fig. 4
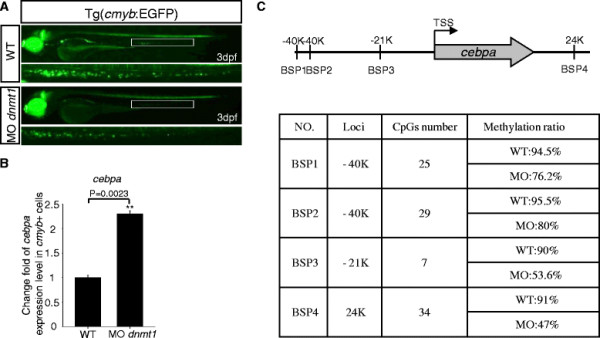
Fluorescent images of the Tg(cmyb-EGFP) line, Q-PCR result of cebpa expression, and bisulfite sequencing PCR (BSP) assay. (A) Fluorescent images of the Tg (cmyb-EGFP) line at 3 dpf. EGFP positive cells in Tg (cmyb:EGFP) dnmt1 morphants were sharply decreased compared with wild-type ones. (B) Cebpa expression level in wild-type and dnmt1 knockdown cmyb-EGFP positive cells. Q-PCR result indicated that there was a significant increase of cebpa expression level in dnmt1 morphants compared with wild-type ones. (C) BSP analysis of putative cebpa regulation regions in cmyb-EGFP positive cells at 3 dpf. The methylation levels of cebpa regulation regions in dnmt1 morphants were significantly decreased in all the four chosen regions compared to those in wild-type embryos.