
Fig. 2
- ID
- ZDB-IMAGE-150526-8
- Genes
- Antibodies
- Publication
- Petersen et al., 2015 - The adhesion GPCR GPR126 has distinct, domain-dependent functions in Schwann cell development mediated by interaction with laminin-211
- All Figures
- Figures for Petersen et al., 2015
|
Fig. 2
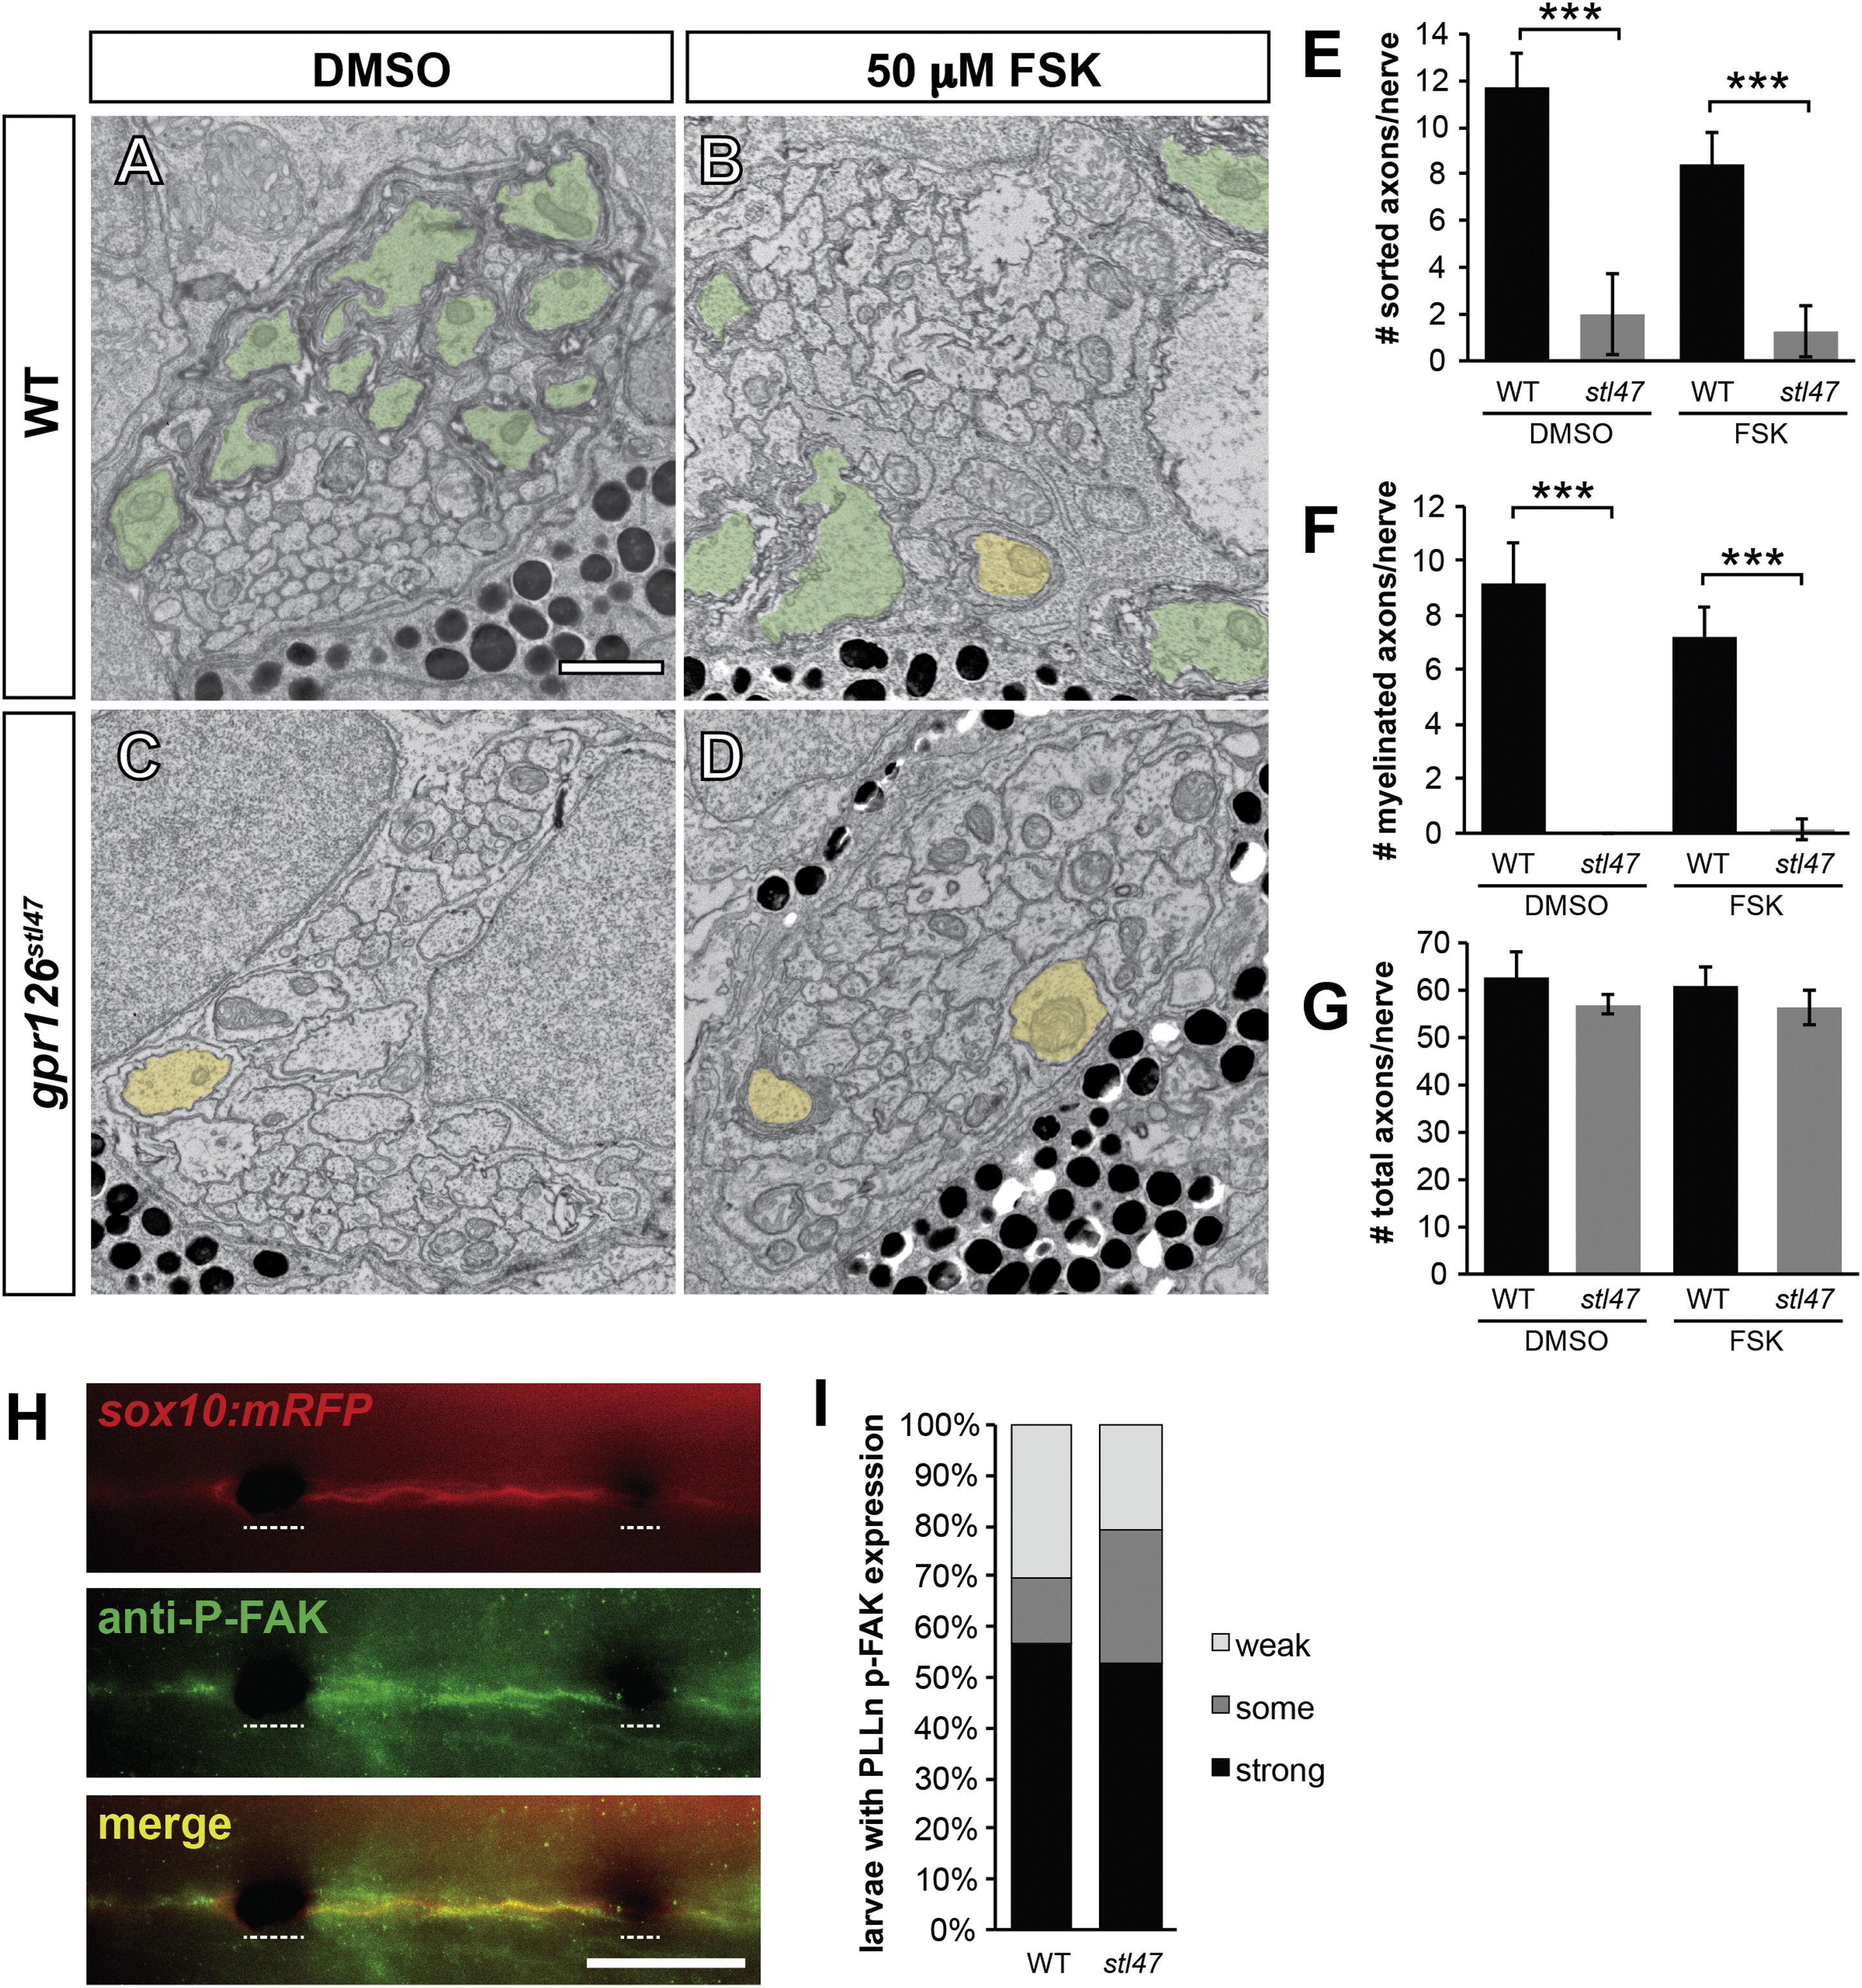
Gpr126-NTF Radial Sorting Occurs Independently of Gpr126-CTF and p-FAK Signaling
(A–D) TEM of 5 dpf zebrafish showing cross-sections through the PLLn. Sorted and myelinated axons are defined and pseudocolored as in Figure 1. The scale bar represents 1 µm.
(A and B) Radial sorting and myelination are observed in WT siblings treated with DMSO (A) and 50 µM FSK (B).
(C and D) Radial sorting and myelination are impaired in gpr126stl47 zygotic mutant siblings treated with DMSO (C) and FSK (D).
(E–G) Quantification of TEM images. Bars represent means ± SD. p < 0.001, one-way ANOVA with Bonferroni’s multiple comparisons test.
(E) Number of sorted axons per PLLn.
(F) Number of myelinated axons per PLLn.
(G) Number of total axons per PLLn.
(H) Phosphorylated FAK (P-FAK) immunostaining (green) labels PLLn SCs of a 4 dpf WT Tg(sox10:mRFP) larva (red). Dotted lines indicate regions where pigment cells obscure fluorescence. The scale bar represents 100 µm.
(I) Quantification of p-FAK levels expressed as a percentage of larvae with SC-specific p-FAK immunostaining along the PLLn in WT and gpr126stl47 mutants. No significant difference was observed in either genotype.