
|
Fig. S1
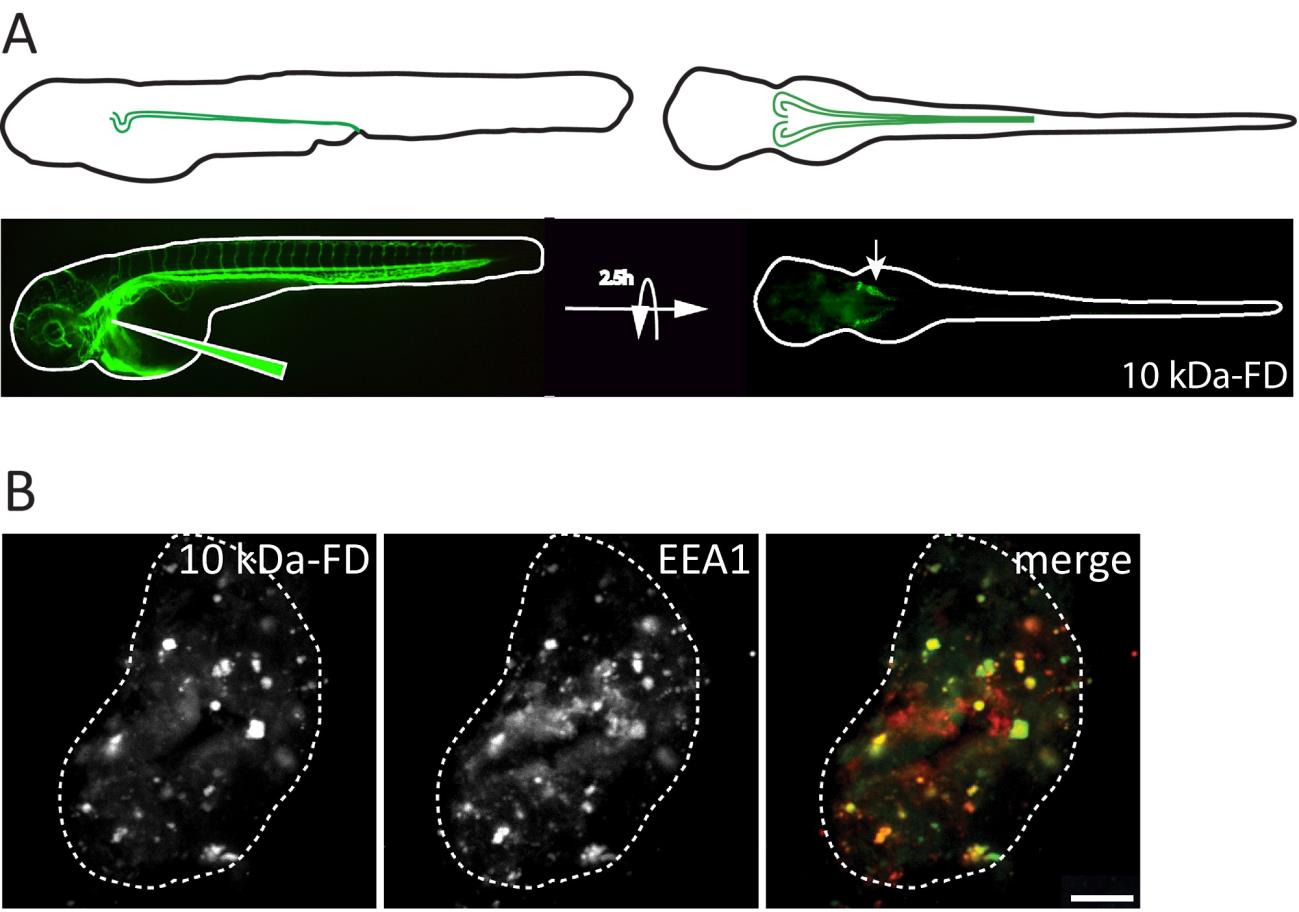
Dextran uptake assay and colocalization with endosomes.
A. Schematic representation of pronephric tubules (green) in 72hpf zebrafish embryos (left lateral view, top right dorsal view) (top) and pronephric uptake assay in 72hpf zebrafish embryos (bottom) showing embryos immediately after injecting Alexa 488-10 kDa dextran (10kDa-FD, green)(left) or after 2.5h incubation to allow accumulation in the pronephros (arrow) (right). B. Confocal transverse section of zebrafish proximal pronephric tubule of 72 hpf zebrafish embryos injected with Alexa 488-10 kDa dextran (green) and incubated for 2.5 h prior to fixation and labelling with antibodies to the early endosome marker EEA1 (red). Scale bar, 5 µm.