
Image
|
Figure Caption
Fig. S2
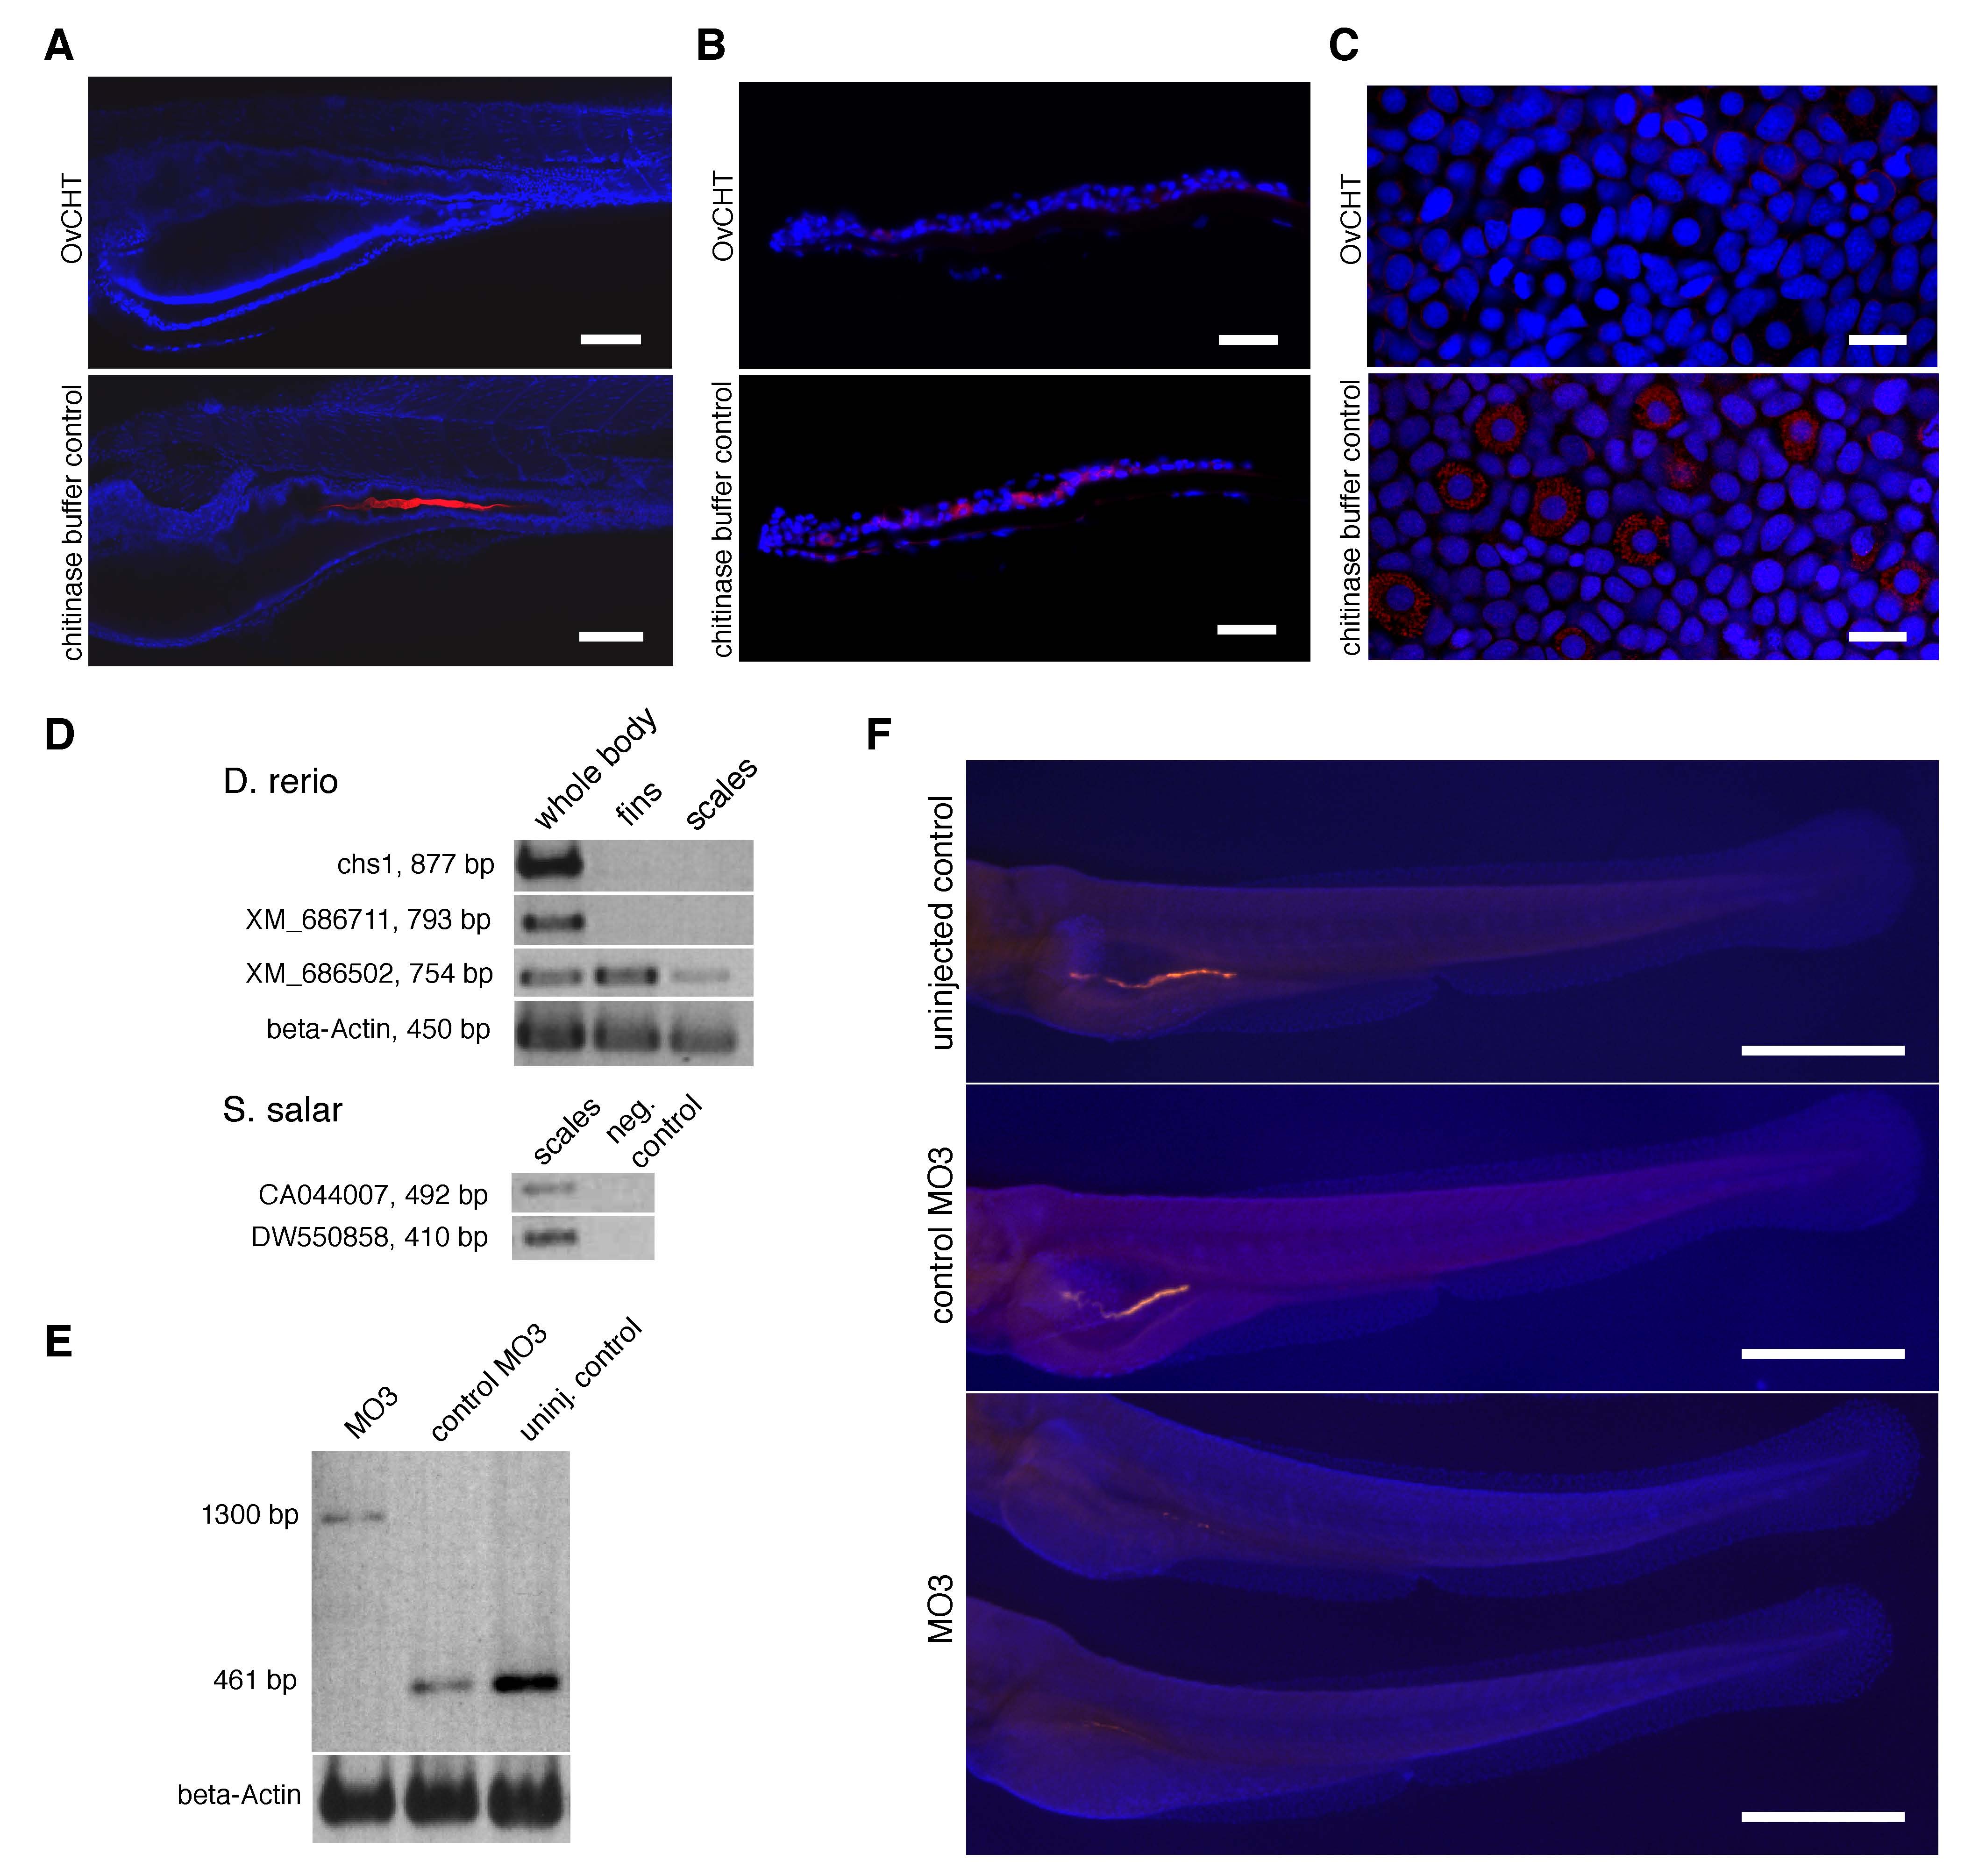
Chitinase treatment of zebrafish and axolotl specimens, and morpholino knockdown of chs1 in zebrafish larvae.
(A, B, C) Chitinase treatment of zebrafish and axolotl larval specimens reduces detection by the CBD probe. (A) 5 dpf larvae were treated with chitinase from Onchocerca volvulus (OvCHT) or with just chitinase buffer, then histochemically detected with CBD-546 (red) and imaged by confocal microscopy. Chitinase-treated larvae showed strongly reduced CBD-546 signals in the intestinal lumen when compared to larvae treated with buffer control. Nuclei were counterstained with TOTO-3 (blue), and rostral is to the left. Scale bars = 100 µm. (B) Similar results were obtained in chitinase experiments carried out in parallel on cryosections of zebrafish scales. CBD-546 signals are visible in the club cells and goblet cells in the control zebrafish scale. Cryosections were counterstained with DAPI and imaged by epifluorescence microscopy. Scale bars = 50 µm. (C) Axolotl young adult caudal fin tissue also showed reduced signals from the CBD-546 probe after chitinase treatment. The control caudal fin tissue, which was dissected from the same axolotl specimen, shows CBD-546 signals in the specialized Leydig epidermal cells. Samples were counterstained with TOTO-3 and imaged by confocal microscopy. Scale bars = 30 µm. (D) RT-PCR results from three adult zebrafish RNA sources (whole body, fins, scales) for three of the four chitin synthase genes (top). Representative RT-PCR results from RNA isolated from Atlantic salmon scales (fingerlings, ~15 cm, 20-30 g) for two ESTs are shown below. These two ESTs were retrieved from the Salmo salar EST database (NCBI) with TBLASTX, using chs1 as the query. (E, F) Knockdown of chs1 using splice-blocking morpholinos. (E) RT-PCR confirmation of splice inhibition by MO3. Similar results were obtained for MO4 and its corresponding control morpholino (not shown). (F) Stereomicroscope images of zebrafish larvae after knockdown of chitin synthase gene chs1 using a splice-blocking morpholino (MO3). Morpholinos (MO3, MO4, or the respective mismatch control morpholinos) were injected into zebrafish embryos at the 1-cell stage, and the resulting larvae were collected at 4 dpf and assayed for chitin. A wildtype, uninjected larva is shown at the top for comparison. Larvae were counterstained with DAPI (blue) for better discrimination of the chitin signals (orange-red). MO3 morphants displayed greatly reduced chitin signals in the gut as compared to controls; the MO4 morphants were similarly affected (not shown). Scale bars = 500 µm.
Figure Data
Acknowledgments
This image is the copyrighted work of the attributed author or publisher, and
ZFIN has permission only to display this image to its users.
Additional permissions should be obtained from the applicable author or publisher of the image.
Full text @ Curr. Biol.