
|
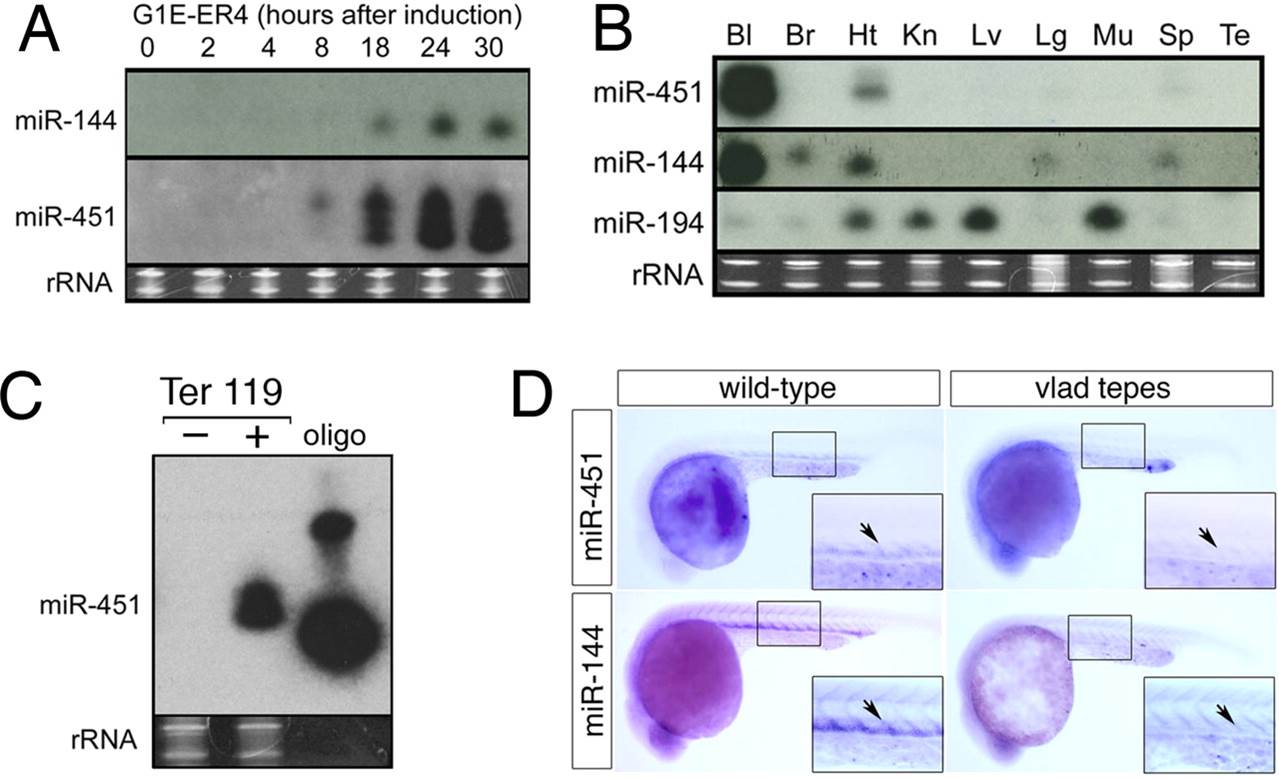
Fig. 1
MiRNAs 144 and 451 are abundant in erythroid tissues and GATA-1-regulated. (A) Northern blot showing induction of miR 144 (Top) and miR 451 (Middle) after activation of a GATA-1-estrogen receptor fusion protein in G1E-ER4 murine erythroblasts. Five micrograms of total cellular RNA was analyzed in each lane. (Bottom) Ethidium bromide staining of 5.8S and 5S rRNAs used as a loading control. (B) Multitissue Northern blot of miR 144 and miR 451 expression in mice. MiR 194, which is expressed in nonhematopoietic tissues, was examined as a control. Five micrograms of total cellular RNAs from the following murine tissues were analyzed: Bl, whole blood; Br, brain; Ht, heart; Kn, kidney; Lv, liver; Lg, lung; Mu, muscle; Sp, spleen; Te, testes. (C) Splenocytes were fractionated according to expression of the erythroid-specific surface antigen Ter119 and analyzed formiR 451 expression by Northern blotting. The third lane labeled “oligo” represents 0.1 pmol of a miR 451“sense” DNA oligonucleotide used as a hybridization control. (D) Expression of miR 451 and miR 144 in zebrafish embryos at 26 hpf. Wild-type and gata-1 (vlad tepes) embryos were analyzed by WISH by using miR 144 and miR 451 probes. Expression of both miRNAs was observed in the blood island of the ICM, shown in the boxed regions. Higher-magnification views of the ICM (arrow) are displayed in the Insets. Expression of miR 451 and miR 144 is markedly reduced in the ICM of vlad tepes embryos.