
|
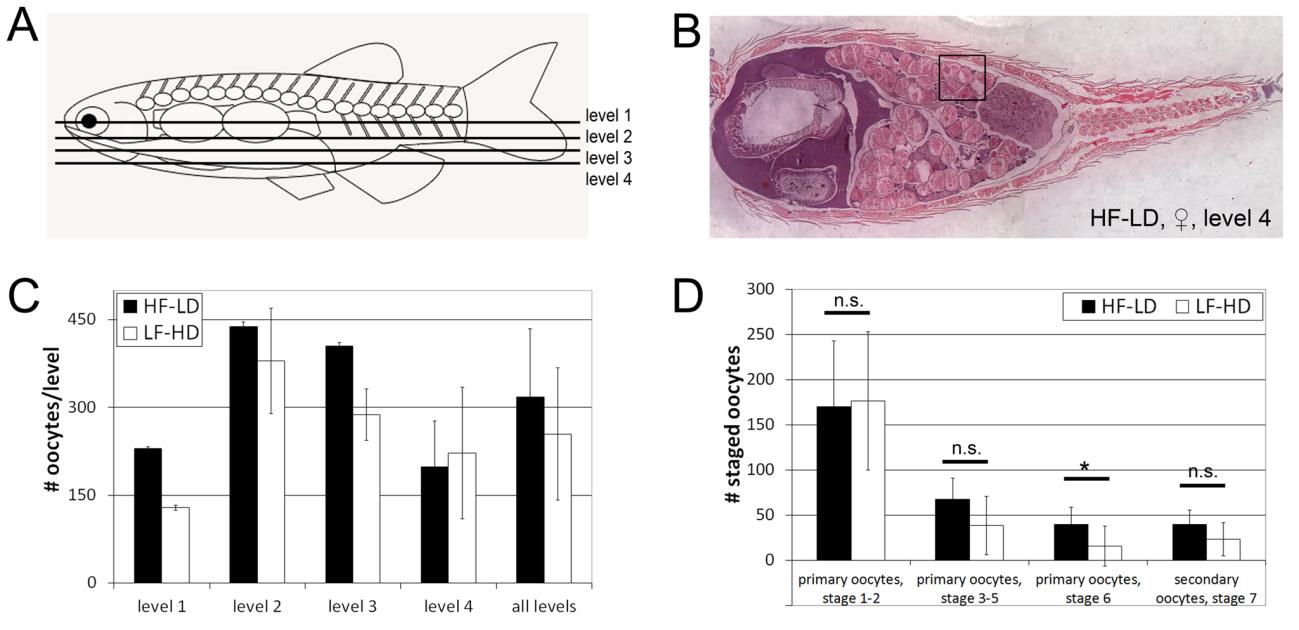
Fig. S6 Caloric intake affects ovarian sizes and oocyte growth rates in in 8.5 months old females—additions to Fig. 5.
A: Schematic overview of the different levels at which longitudinal sections were used to analyze oocytes. B: Overview of an H&E stained section of a female HF-LD fish at level 4; boxes show location of the area shown in Fig. 5E,F. C: Numbers of oocytes of LF-HD and HF-LD females in each of the 4 analyzed levels, n = 3 for level 1–4, n = 12 for all levels. D: Absolute numbers of oocytes per maturation stage of HF-LD and LF-HD females in all of the four analyzed dorsoventral levels; * indicates a significant difference (p<0.05), n.s.means not significant according to the Student`s T test, n = 3. Similar results were obtained in a second, independent experiment.