
|
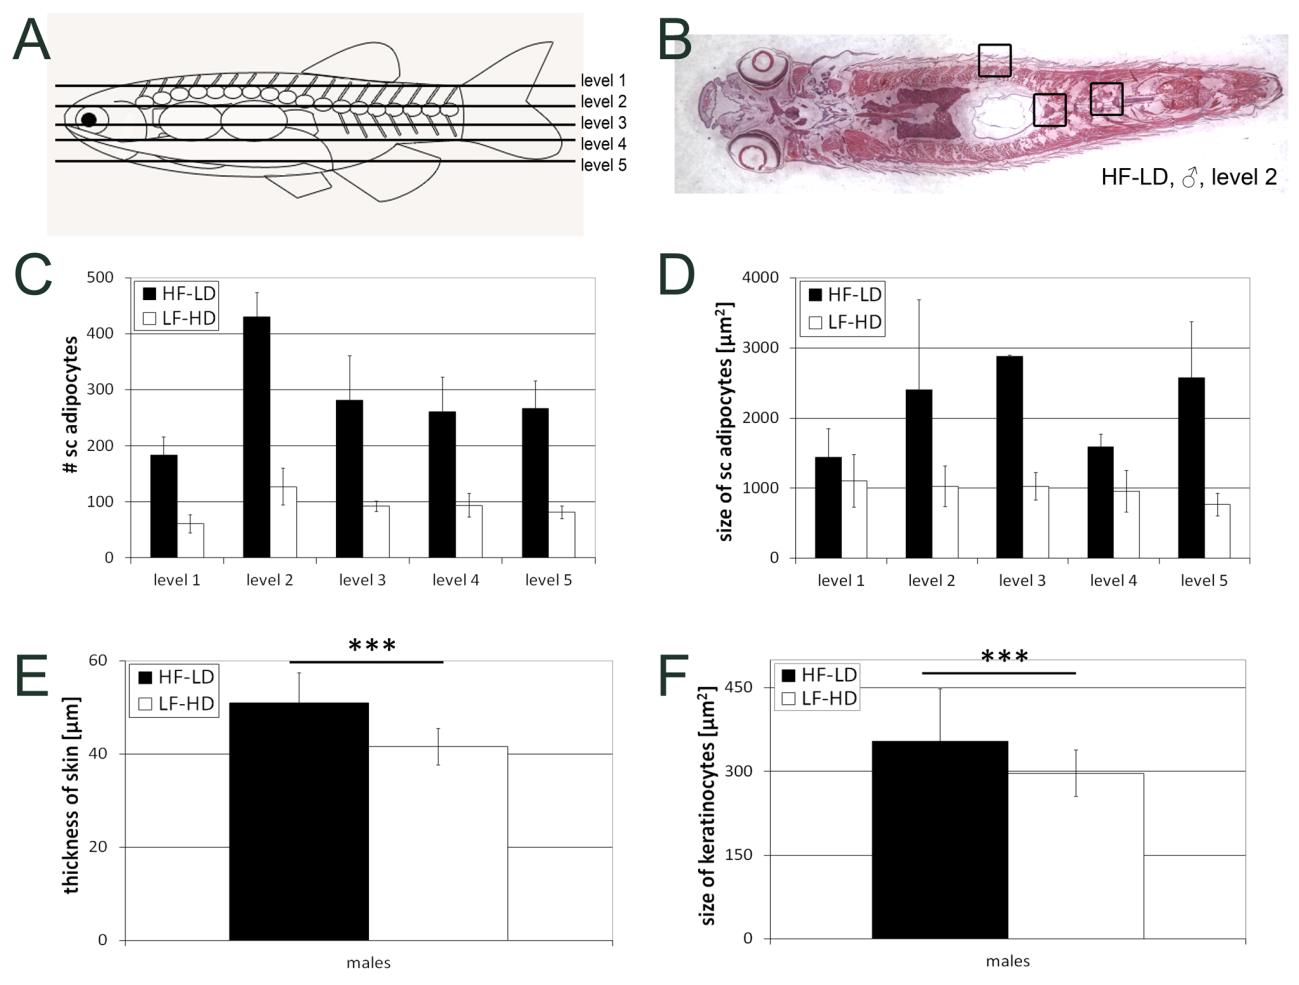
Fig. S5 Reduction of BMI and TG levels in 18 months old male zebrafish is accompanied with a reduction in adipocyte sizes.
A: Schematic overview of the different levels of which longitudinal sections were used to analyze subcutaneous adipocytes; B: overview of an H&E stained section of a male HF-LD fish at level 2, boxes show locations of the areas shown in Fig. 4 A-H; C-D: Numbers (C) and sizes (D) of subcutaneous adipocytes of male LF-HD and HF-LD fish with an age of 18 months shown for each of the 5 analyzed levels, n = 8 (2 fish per condition, 2 sections per level and 2 sides per section); E,F: Thickness of the skin (E) and sizes of keratinocytes (F) of male LF-HD and HF-LD fish, determined at the level of the most posterior scale for each level, means of all levels are shown; *** indicate significant difference with p<0.001 according to the Student`s T test, n = 20 (for thickness, 2 fish per condition, 5 measurements per side of the analysed section) or n = 40 (for size, 2 fish per condition, 10 measured keratinocytes per side of the analysed section). Similar results were obtained in second, independent experiments.