
|
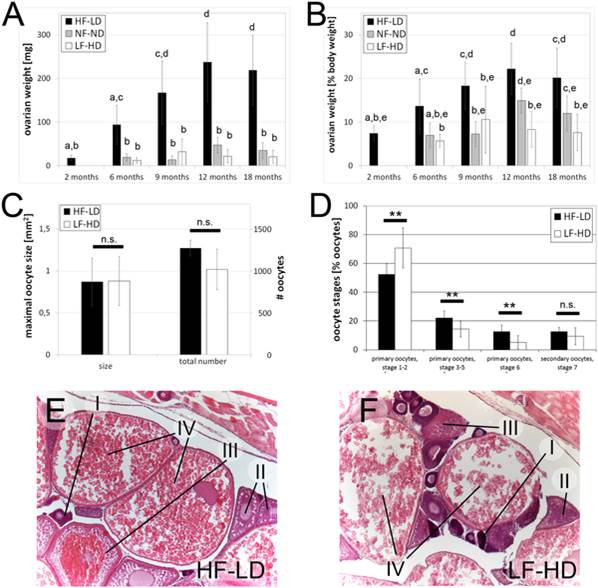
Fig. 5 Hyperphagia leads to increased ovarian sizes and enhanced oocyte growth rates, while not affecting final oocyte sizes.
A-B: Weight of ovaries of female LF-HD, NF-ND and HF-HD in mg (A) and in % total body weight (B) at different ages; at an age of 2 months, numbers could only be supplied for HF-LD females, since NF-ND and LF-HD fish of this age were not sexually mature as yet; columns with same superscript letter are not significantly different (p>0.05) according to ANOVA followed by the Least Significant Difference (Bonferroni’s) test, n e 5. C: Sizes of fully grown oocytes and total number of oocytes of female LF-HD and HF-LD fish were not significantly (n.s.) different according to the Student`s T test, n = 10 (10 biggest oocytes of all levels) or n = 3 (3 females). D: Relative numbers of oocytes per maturation stage of HF-LD and LF-HD females (in % of total oocyte numbers) in all of the four analyzed dorsoventral levels (compare with S6A Fig.); ** indicates significant differences (p<0.01), n.s. means not significant according to the Student`s T test, n = 3. E-F: H&E staining of longitudinal sections through ovaries of HF-LD (E) and LF-HD female (F), 8.5 months of age, dorsoventral level 2. I: primary oocyte, stage 1–2 (previtellogenic); II: primary oocyte, stage 3–5 (previtellogenic); III: primary oocyte, stage 6 (vitellogenic); IV: secondary oocyte (meiotic arrest), stage 7; staging was done as described [71,72]. Similar results were obtained in second, independent experiments.