
|
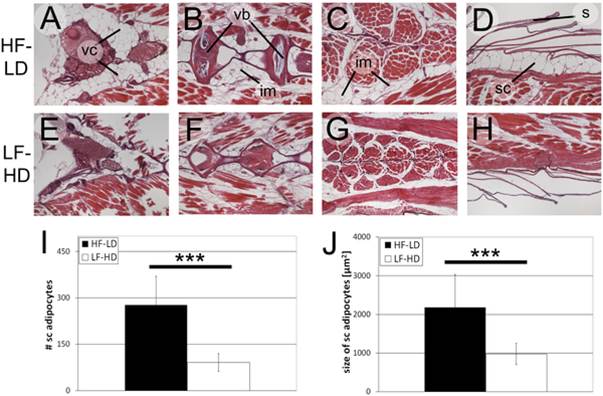
Fig. 4 Aged (18 months old) male HF-LD and LF-HD fish display decreased adipocyte sizes but unaltered adipocyte numbers compared to middle-aged fish.
A-H: H&E staining on longitudinal sections of male LF-HD (E-H) and HF-LD (A-D) fish showing visceral (A,E), subcutaneous (D,H) and intermuscular (B,C,F,G) adipocytes at dorsoventral levels 2 (A,B,D,E,F,H) or level 4 (C,G) (compare with S5A Fig.); I,J: Average total numbers of subcutaneous adipocytes per level (I) and sizes (J) of subcutaneous adipocytes of male LF-HD and HF-LD fish (body length 32.3 +/- 1.0 mm (male HF-LD), 22.5 +/- 1.0 mm (male LF-HD)) from 5 corresponding longitudinal levels along the dorsoventral axis (S5C,D Fig.); *** indicates significant differences (p<0.001) according to the Student`s T test, n = 40 (2 fish per condition, 5 levels per fish, 2 sections per level and left and right per section). Similar results were obtained in an additional, independent experiment. Abbreviations: im, intermuscular adipocytes; s, scale; sc, subcutaneous adipocytes; vb, vertebral body; vc, visceral adipocytes.