
|
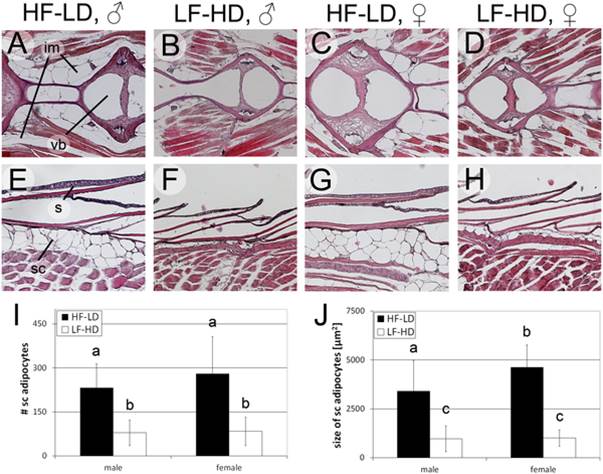
Fig. 3 Hyperphagia results in hyperplastic and hypertrophic adipocytes in middle-aged fish.
A-H: H&E staining of longitudinal sections of male (A,B,E,F) and female (C,D,G,H) HF-LD (A,C,E,G) and LF-HD (B,D,F,H) fish, 6.5 months of age, dorsoventral level 2 (compare with S4A Fig.); I-J: Average total numbers of subcutaneous adipocytes per level (I) and sizes (J) of subcutaneous adipocytes of male and female LF-HD and HF-LD fish (body length 28.8 +/- 0.9 mm (male HF-LD), 21.2 +/- 1.5 mm (male LF-HD), 31.1 +/- 1.4 mm (female HF-LD) and 20.8 +/- 1.4 mm (female LF-HD)) from 5 corresponding longitudinal levels along the dorsoventral axis (see S4C,D Fig.); columns with different superscript letters are significantly different (p<0.05) according to ANOVA followed by the Least Significant Difference (Bonferroni’s) test, n = 40 (2 fish per condition, 5 levels per fish, 2 sections per level and left and right sides per section). Similar experiments were obtained in an additional, independent experiment. Abbreviations: im, intermuscular adipocytes; s, scale; sc, subcutaneous adipocytes; vb, vertebral body.