
|
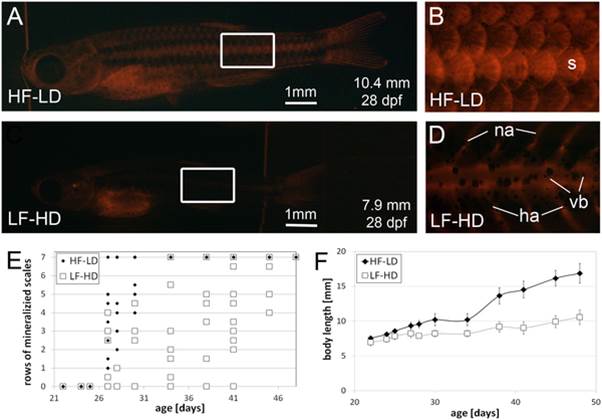
Fig. 1 Hyperphagia results in increased linear growth and earlier scale formation
A-D: Alizarin red staining of age-matched (28 dpf) juvenile fish (A,C) and corresponding magnification of the flank (B,D) of fish raised with high amounts of food at low density (A,B; HF-LD) and low amounts of food at high density (C,D; LF-HD). Body lengths of the shown individuals are indicated. Regions magnified in (B,D) are boxed in (A,C). E: Graph summarizing scale mineralization status (number of rows of mineralized scales) of analyzed fish at different ages. HF-LD fish started to display 7 rows of mineralized from an age of 27 days onwards, while it took LF-HD fish at least 34 days to reach this stage. F: Body length growth curves of sibling fish as in (A-E) shown as mean +/- standard deviation of 10 analyzed fish per condition and time point. LF-HD fish are significantly shorter than HF-LD fish. Similar results were obtained in a second, independent experiment. Abbreviations: ha, hemal arch; dpf, days post-fertilization; na, neural arch; s, scale; vb, vertebral body.