
Image
|
Figure Caption
Fig. S6
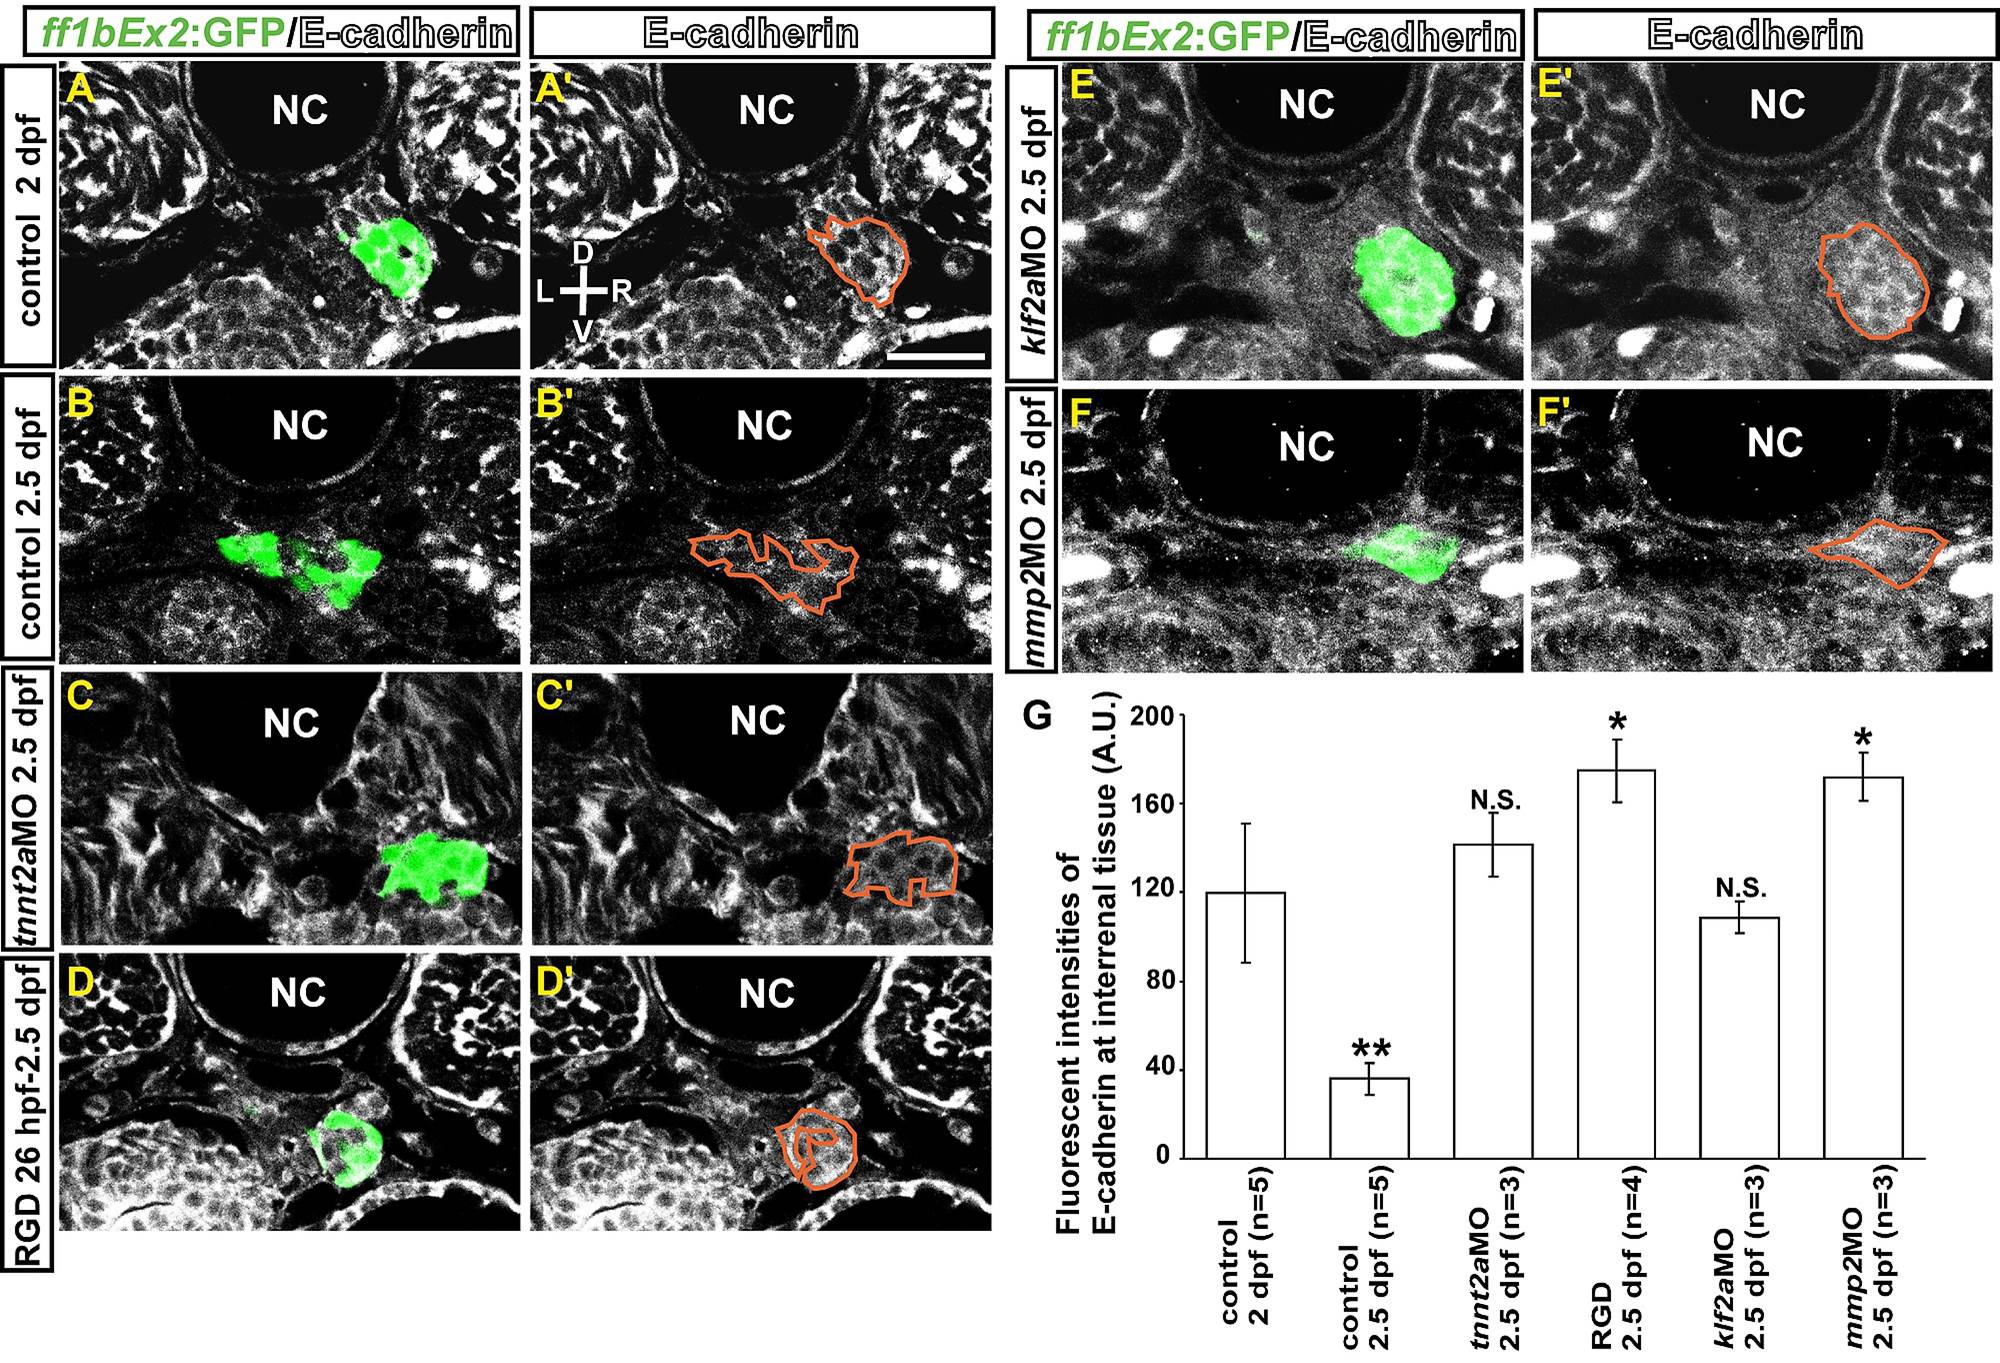
Steroidogenic cells display a decrease of E-cadherin expression which is induced by hemodynamic forces and pFak signaling.
E-cadherin in the fluorescent steroidogenic tissue of Tg(ff1bEx2: GFP) embryos was decreased from 2 dpf (A-A′) to 2.5 dpf (B-B′). The decrease in E-cadherin was not observed in (C, C′) tnnt2a morphants, (D, D′) RGD-treated embryos, or (E, E′) klf2a or (F, F′) mmp2 morphants. Sections are shown of a representative embryo from each treatment group. (F) Fluorescence intensity of E-cadherin in ff1bGFP-expressing steroidogenic tissue is normalized to the size of the cluster, with the number of embryos indicated in parentheses. The difference between 2-dpf control group and any of the other groups was analyzed by Student′s t-test. *P<0.05, **P<0.005, N.S., not significant. D, dorsal; V, ventral; L, left; R, right. Abbreviations: notochord (NC). Scale bar, 25 µm.
Acknowledgments
This image is the copyrighted work of the attributed author or publisher, and
ZFIN has permission only to display this image to its users.
Additional permissions should be obtained from the applicable author or publisher of the image.
Full text @ PLoS One