
|
Fig. 6 Steroidogenic cells are induced to undergo an EMT-like change by hemodynamic forces and pFak signaling.
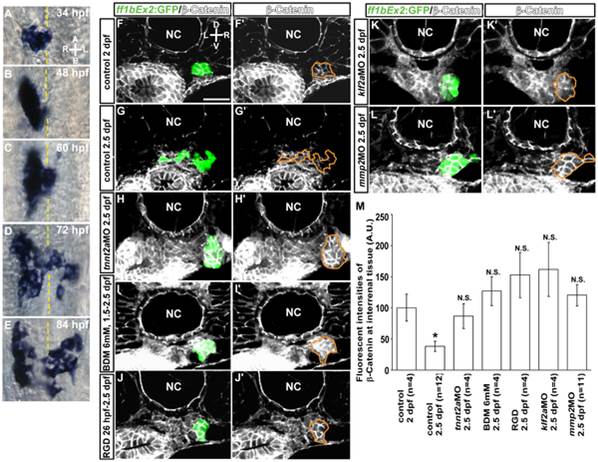
(A–E) Ventral view of the midtrunk from 34 to 84 hpf; steroidogenic cells become loosely associated and develop protrusions at the cell surface. The accumulation of β-Catenin at cell-cell junctions in the steroidogenic tissue can be seen in cross sections of Tg(ff1bEx2: GFP) embryos at (F, F′) 2 dpf, but not at (G, G′) 2.5 dpf. The decrease in junctional β-Catenin was not observed in (H, H′) tnnt2a morphants, (I, I′) 2,3-BDM- or (J, J′) RGD-treated embryos, or (K, K′) klf2a or (L, L′) mmp2 morphants. Sections are shown of a representative embryo from each treatment group. (M) Fluorescence intensity of β-Catenin in ff1bGFP-expressing steroidogenic tissue (ROI marked by orange lines) is normalized to the size of the cluster, with the number of embryos indicated in parentheses. The difference between 2-dpf control group and any of the other groups was analyzed by Student′s t-test. *P<0.05, N.S., not significant. A, anterior; P, posterior; L, left; R, right; D, dorsal; V, ventral. Broken yellow lines indicate position of the midline. Abbreviations: notochord (NC). Scale bar, 25 µm.