
|
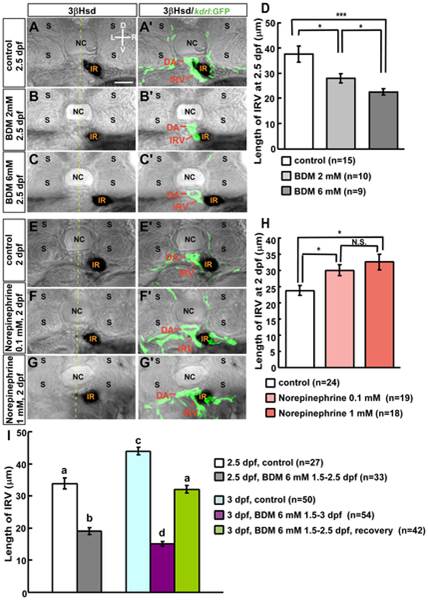
Fig. 3 Effects of 2,3-BDM and norepinephrine on IRV formation.
For repression of blood flow, Tg(kdrl: GFP)s843 embryos were treated with (A–A′) vehicle (control), or 2,3-BDM at a concentration of (B–B′) 2 mM or (C–C′) 6 mM from 1.5 dpf, and harvested at 2.5 dpf. For acceleration of blood flow, Tg(kdrl: GFP)s843 embryos were treated with (E-E′) vehicle (control), or norepinephrine at a concentration of (F–F′) 0.1 mM or (G-G′) 1 mM from 33 hpf, and harvested at 2 dpf. Transverse sections of harvested embryos were subject to analysis of 3β-Hsd activity (black) and GFP expression (green). IRV lengths of 2,3-BDM- or norepinephrine-treated embryos were quantified in (D) and (H), respectively; which were verified from confocal Z-stacks covering the full range of IRV growth, and measurements were made from single focal planes displaying the maximal range of ventrally extending IRV. *P<0.05, ***P<0.0005, N.S., not significant (Student′s t-test). (I) Repressing effect of 2,3-BDM (6 mM) on IRV growth was reversible at 3 dpf, as the 2,3-BDM applied from 1.5 dpf was washed out at 2.5 dpf. The IRV length in recovered embryos at 3 dpf was not significantly different from that in control embryos at 2.5 dpf. Histograms with different letters above them are significantly different (ANOVA and Duncan′s multiple test, P<0.05). D, dorsal; V, ventral; L, left; R, right. Abbreviations: interrenal tissue (IR), notochord (NC), somite (S). Scale bar, 25 µm.