
Image
|
Figure Caption
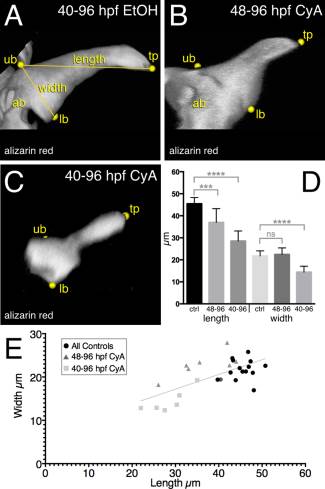
Fig. 7
Reduction in mineralized tooth size associated with hedgehog inhibition. A–C: 3D renderings of 96 hpf mineralized tooth #1 using alizarin red staining and confocal microscopy. A: 40–96 hpf EtOH treated control tooth #1. B: 48–96 hpf CyA exposed tooth. C: 40–96 hpf CyA treated tooth. Labels: tp, tooth tip; ub, upper point of base; lb, lower base; ab, attachment bone. D: Graph of measurement means. Error bars = standard deviation. E: XY plot of all measurements. Best fit line is shown (R2 = 0.46; P < 0.0001). Significance tests: ***P < 0.001; ****P < 0.0001; ns = not significant.
Acknowledgments
This image is the copyrighted work of the attributed author or publisher, and
ZFIN has permission only to display this image to its users.
Additional permissions should be obtained from the applicable author or publisher of the image.
Full text @ Dev. Dyn.