
|
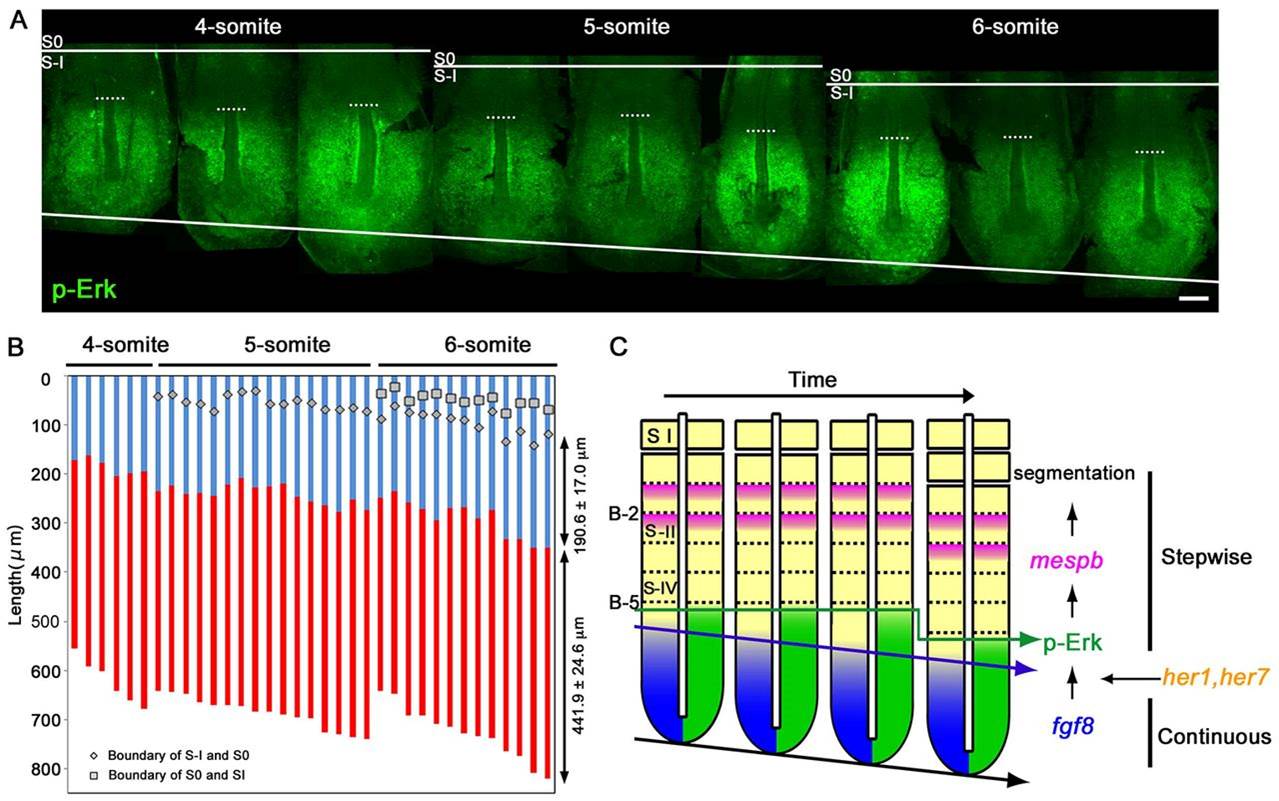
Fig. 4
Double knockdown of her1 and her7 leads to loss of stepwise p-Erk pattern during somite segmentation. (A) Representative images of p-Erk distribution in embryos at the 4- to 6-somite stages. Dorsal view of the tailbud region, anterior to the top. Scale bar: 100 µm. (B) Quantitative data of p-Erk distribution in her1 and her7 morphants (n=35). Red and blue stripes within each column indicate ON and OFF regions, respectively, of p-Erk activity in each embryo. Statistical significance of variation (2P>0.05) could not be seen in the OFF region (C.V.=0.089) versus the ON region (C.V.=0.056). (C) Generation of the future somite boundary at B-5. The fgf8a mRNA gradient progresses continuously towards the posterior at the same rate as elongation of the PSM, whereas the activity of p-Erk, downstream of FGF signalling, exhibits a stepwise pattern during each somite segmentation. This pattern is generated by a mechanism depending on the somite segmentation clock in zebrafish. The anterior limit of Erk activity represents the positioning of the future somite boundary at B-5; p-Erk is therefore an earlier molecular marker of the future somite boundary than mesp-b, a determinant of the future somite boundary at B-2.